
 ByAiden
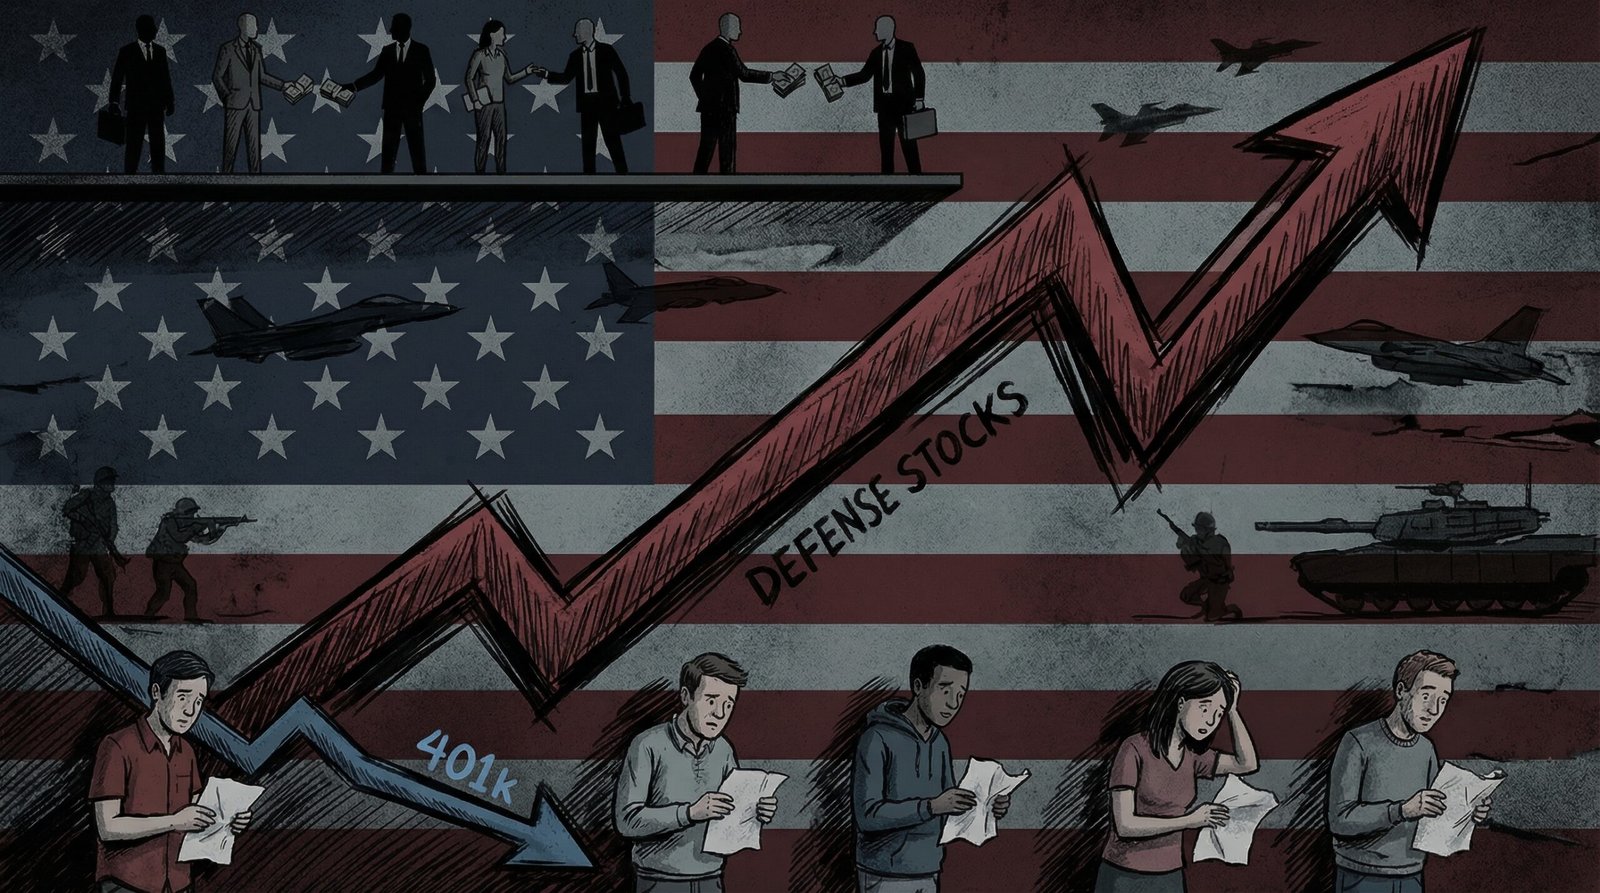
Iran War Winners and Losers: Defense Stocks Up 40%, Your Gas Bill Up 64%
The Iran war is 'pretty much complete' per Trump — here's who actually won: Lockheed +40%, Northrop +6%, Valero +26%. And who lost: you, your gas bill, your 401(k), and the 92,000 workers who lost jobs in February.
Share your love
The Iran War winners and losers are now clear: 10 days into Operation Epic Fury, defense contractors have banked tens of billions in stock gains, Boomer-heavy energy portfolios surged as oil briefly hit $120 a barrel, and working Americans are stuck with $4-plus gas, a cratered jobs market, and a retirement account that lost ground while Lockheed Martin’s stock climbed 40%. Now that Trump is calling the war “pretty much complete,” the receipts are in — and they’re infuriating.
Key Takeaways
- Lockheed Martin is up 40% since January 2026 as Iran tensions escalated — RTX +4.7%, Northrop Grumman +6% on the war’s first day alone
- Oil briefly hit $119/barrel on March 9 — up from $72.50 pre-war — before retreating; working-class families pay a disproportionate share of every gas price spike
- The war costs $891 million per day, with a total economic impact estimated at up to $210 billion by the Penn Wharton Budget Model
- 92,000 jobs were lost in February — the same month the war started — threatening a stagflation trap that crushes younger workers hardest
- Boomers own the majority of energy stocks and defense holdings; Millennials and Gen Z hold the majority of the gas tab and the national debt that funded the missiles
Who Actually Won the Iran War?
On March 9, 2026, day ten of Operation Epic Fury, President Trump told NBC News that the Iran war was “very complete, pretty much.” Whether that’s a ceasefire preview or classic Trumpian premature victory-lapping remains to be seen — but the financial scoreboard doesn’t need to wait for a formal end.
The winners: Defense contractors, oil investors, and anyone who was already wealthy enough to hold equity in companies that manufacture Patriot missiles at $4 million a pop. The losers: the American working class, which watched its gas bill spike, its 401(k) crater, and its job market shed 92,000 positions — all in the same month the bombs started falling.
Iran’s Foreign Minister Abbas Araghchi unwittingly provided the most accurate economic analysis of the entire conflict on March 9, writing on X: “Blame for surging gas prices, costlier mortgages, and pummeled 401(k)’s lies squarely with Israel and its dupes in Washington.” Strip away the propaganda context and that’s just… a fairly accurate description of what happened to working Americans. Even the enemy knows the score.
This is the story of who paid for the Iran war — and who cashed out.
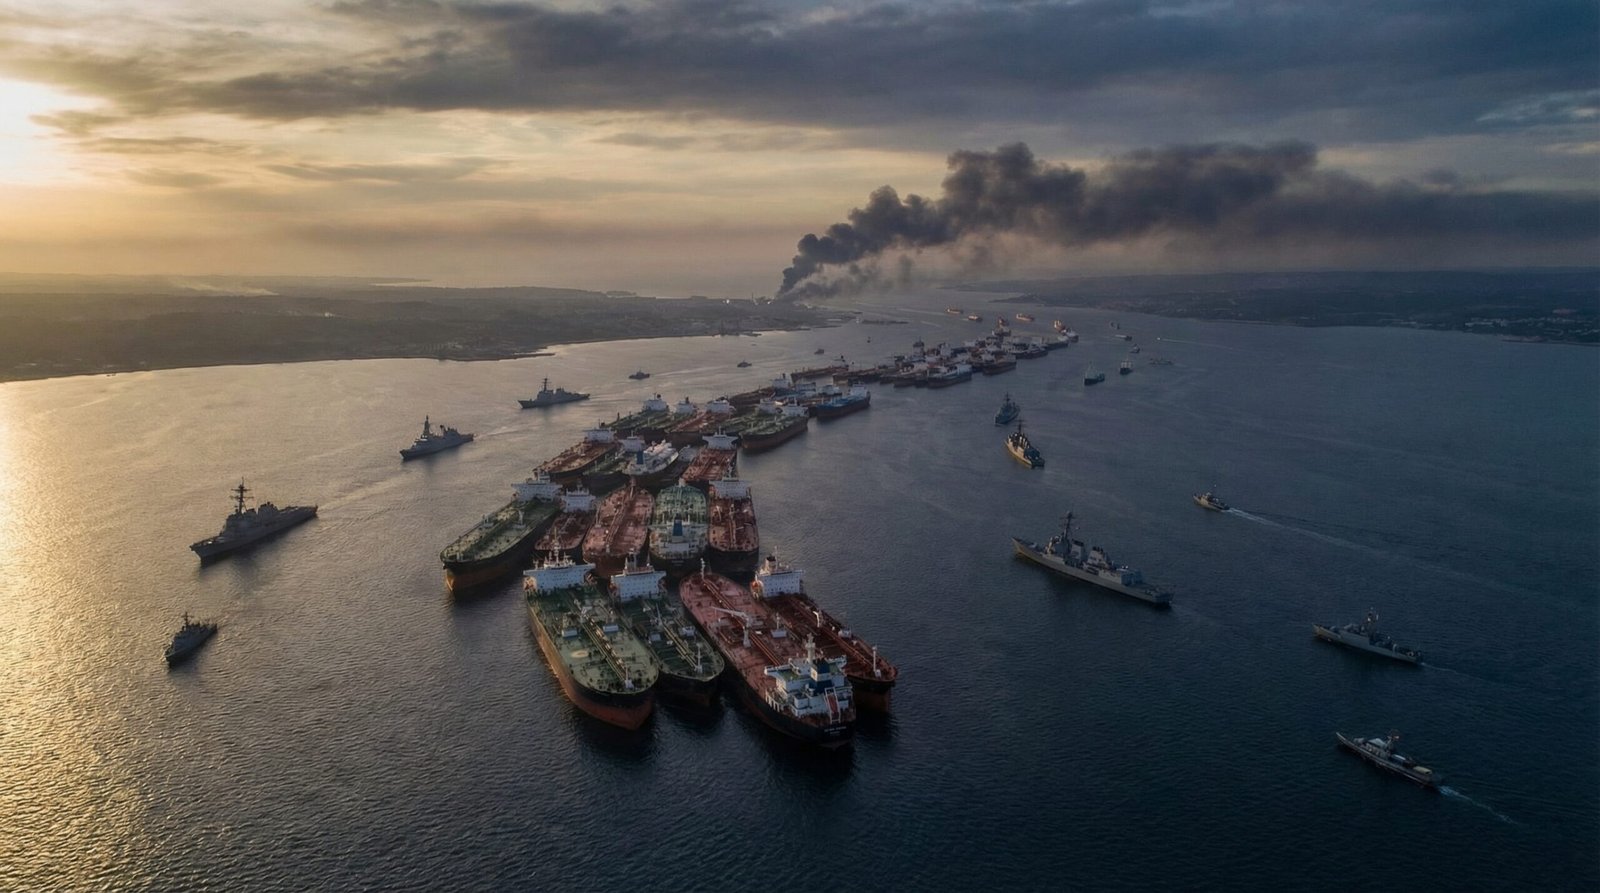
How the Hormuz Blockade Became Your Problem
The Strait of Hormuz is a 21-mile-wide chokepoint between Iran and Oman through which roughly 20% of the world’s oil and 17% of global liquefied natural gas flows every single day. When the US and Israel launched Operation Epic Fury on February 28, 2026, Iran effectively blocked it — not through a formal closure but through a combination of drone and missile attacks on tankers, soaring war-risk insurance premiums, and the practical reality that no shipping company was going to send a $300 million supertanker through a war zone for ordinary rates.
The result: supertanker day rates doubled from $200,000 to over $400,000 per day in a single week, according to Reuters — its biggest weekly gain in four years. Fertilizer prices spiked nearly 25% (urea hit $578 per ton). Airline fuel surcharges started climbing. Qatar — a major supplier of liquefied natural gas — declared force majeure and halted exports entirely, removing roughly 17% of global LNG supply overnight.
All of that cost flows downstream. Within 12 months, analysts at Bloomberg and Chatham House warned, these shipping cost increases will ripple through consumer prices across the supply chain. This isn’t abstract macroeconomics — it’s your grocery bill, your Amazon delivery, your utility rate. The Hormuz supply chain crisis is already priced into your future.
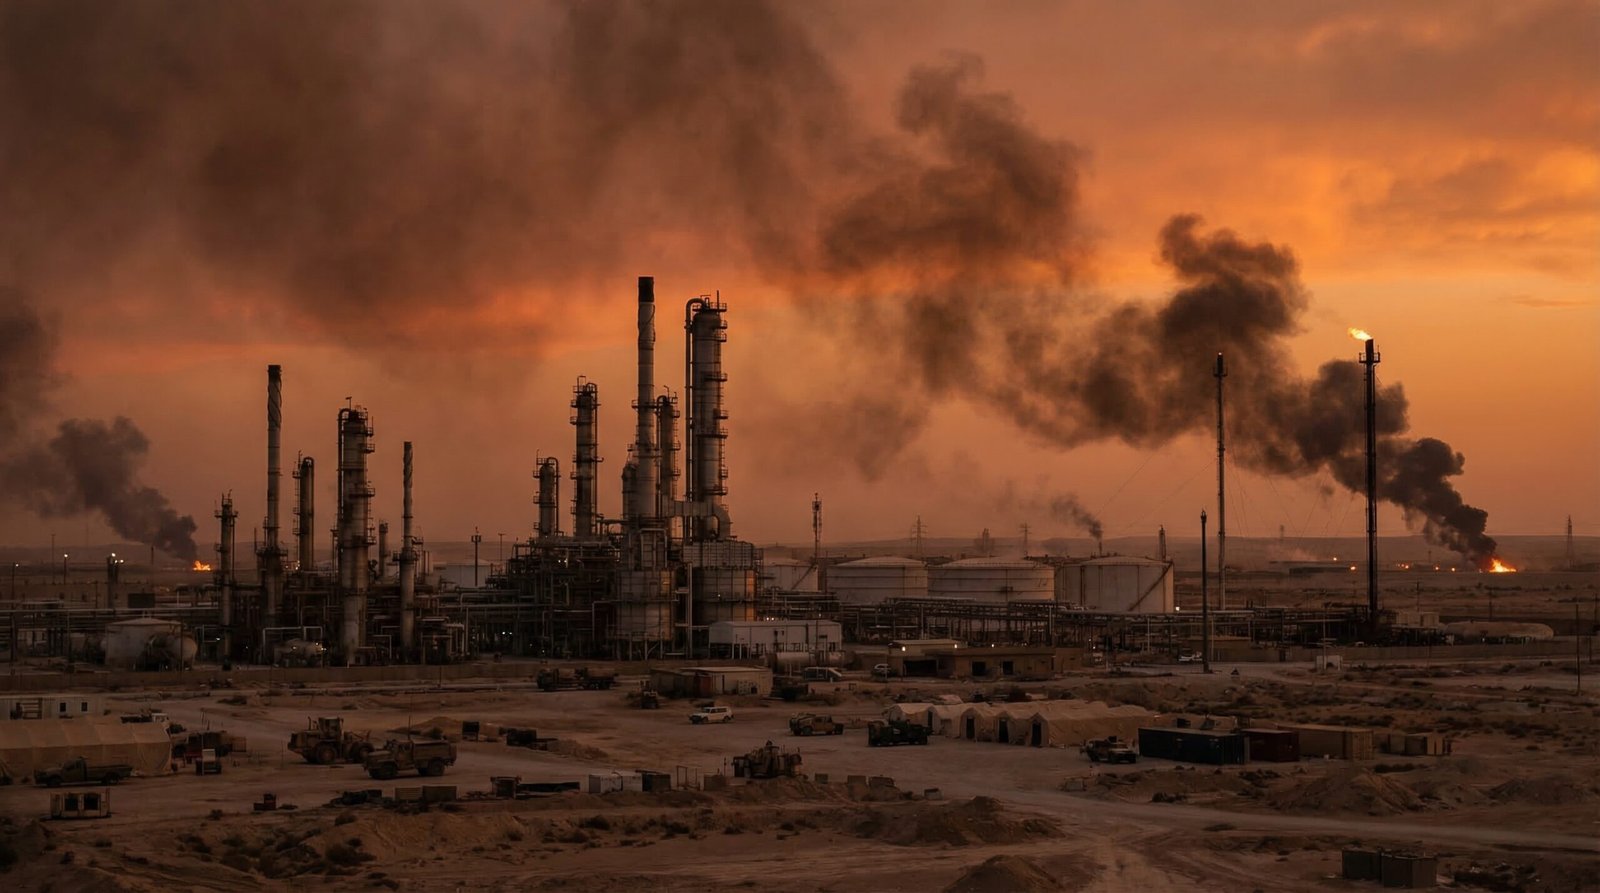
Meanwhile, the American energy independence myth got its final stress test. Despite record US domestic oil production, the global oil market is interconnected — and when 20% of world supply gets threatened, everyone pays, regardless of where their barrel came from.
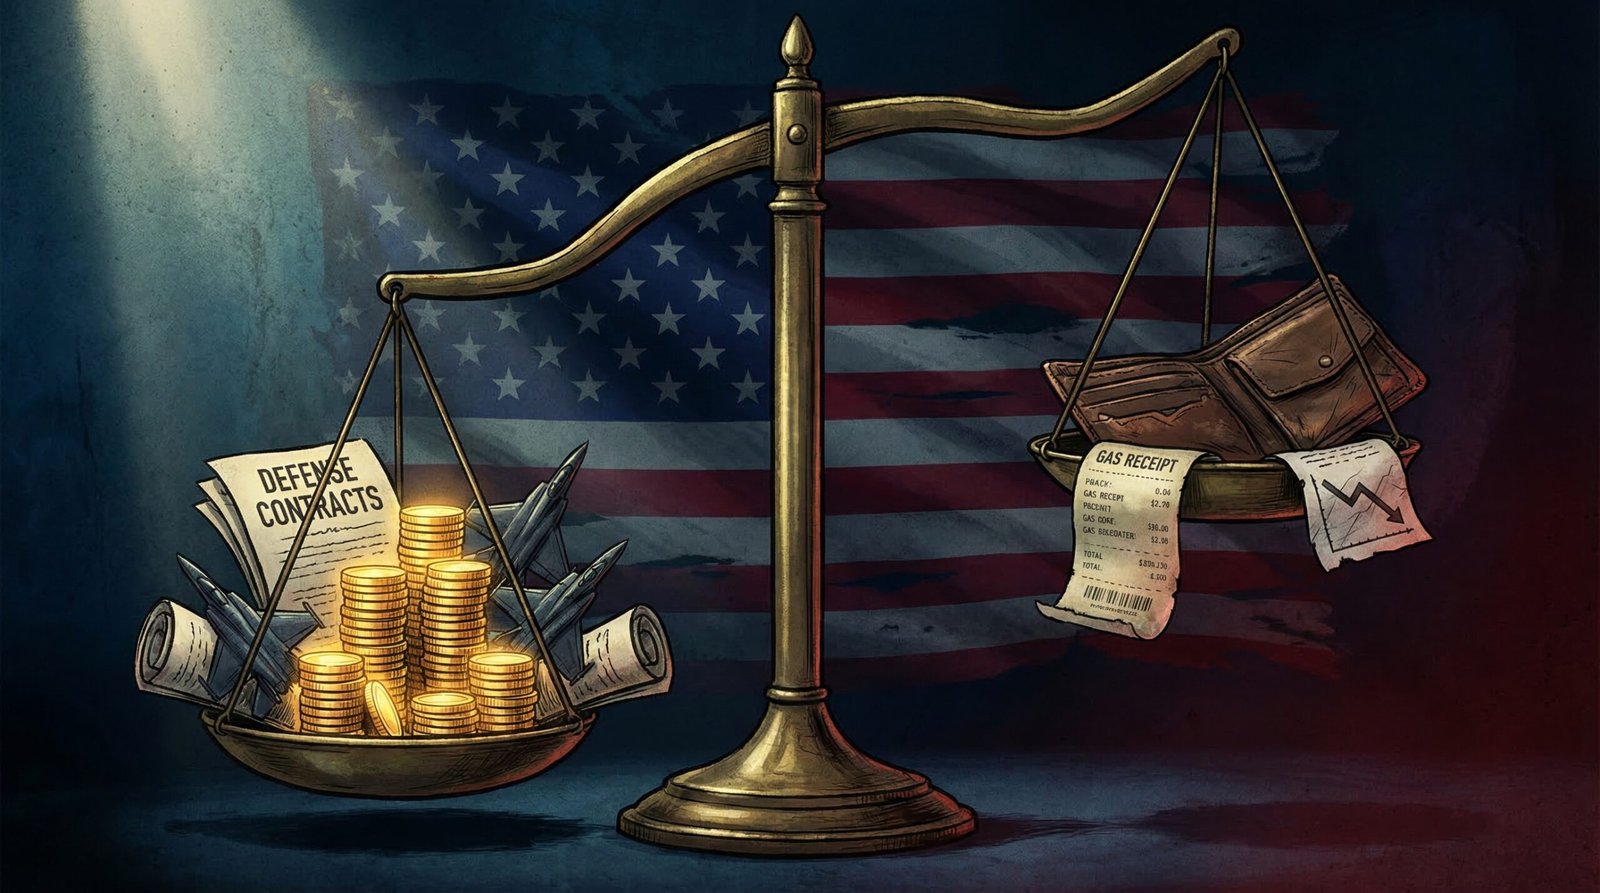
Defense Contractor Windfall: The Numbers
Here’s what the Iran war winners and losers ledger looks like for the defense industrial complex:
Lockheed Martin (LMT): +40% since January 2026 as Iran tensions escalated; +3.3% on the war’s first trading day. The company’s THAAD interceptor missile — a $12.77 million unit — became suddenly relevant, and Lockheed signed agreements to quadruple production from 96 to 400 per year. The Patriot missiles that NATO allies were firing at incoming Iranian drones? Also Lockheed/RTX. Also $4 million each. In some engagement scenarios, 11 Patriot missiles were used to intercept a single Iranian drone. Defense economists call this “asymmetric cost exchange” — the polite term for the enemy winning the economics.
RTX (Raytheon parent): +4.7% on day one of the war. Northrop Grumman: +6% — its largest single-session gain in years. Palantir Technologies: +5.8%. Boeing, more dependent on commercial aviation than defense, posted a modest +1-2%. Defense contractor profits from the Iran war were not a surprise to anyone who has read a history book — they never are.
Energy companies, less directly connected to the bombing campaign but enormously benefiting from the oil price surge: Valero Energy +25.95%, Exxon Mobil +9% in the first days. Venture Global and Cheniere Energy — LNG exporters who benefit when Qatar goes offline — posted notable gains as well.
Defense executives were literally invited to the White House for meetings as strikes depleted weapons stockpiles, according to Reuters. A war that depletes Patriot missiles is a Raytheon revenue opportunity. That’s not cynicism — it’s a contractual relationship sanctioned by the United States government.
What Working Americans Actually Lost
Start with the gas bill. Oil went from $72.50 per barrel pre-war to briefly touching $119 per barrel on March 9 — an increase of 64% in 10 days. The national gas price average hit $3.41/gallon in the first week alone, up $0.43 overnight. In California, where prices were already elevated due to refinery regulations, the premium was even steeper.
For context: lower-income American households spend roughly 17.8% of their after-tax income on energy — more than three times the share spent by high-income households. Every $0.50 increase in the national average gas price costs the median American family roughly $500–600 per year. It disproportionately hits workers who commute by car, delivery drivers, rideshare workers — exactly the demographic that the gig economy already hollowed out.
Then there’s the job market. February’s jobs report, released March 6, showed the economy shed 92,000 positions as war uncertainty paralyzed hiring decisions. The unemployment rate ticked up to 4.4%. This came with downward revisions to previous months — suggesting the labor market was already weakening before the bombs fell. As the Iran war torched the jobs report, the Fed was caught in an impossible position: cut rates to stimulate employment, or hold them to fight the inflation the war was generating.
The Penn Wharton Budget Model put the total economic cost at up to $210 billion. CSIS calculated that the first 100 hours of combat alone cost $3.7 billion. CNN reported the daily military operations tab at $891.4 million. That’s not a line item in someone’s defense budget — it’s deficit spending that lands on the national debt, which younger generations are constitutionally required to pay.
The S&P 500 fell 1.5% at open on March 3 as the conflict escalated. Morningstar noted that 401(k) millionaires — a record number as of early 2026 — would face a “discipline test.” Cute framing for the reality that millions of Millennials and Gen Z workers watched already-modest retirement accounts shrink while Lockheed’s stock climbed to new highs.

The Generational Divide: Boomers Owned the Upside
The distributional math of the Iran war tracks almost perfectly with existing wealth concentration patterns. Baby Boomers hold approximately 51% of US net wealth — and critically, they hold a disproportionate share of the asset classes that benefited most from the conflict: energy stocks, defense-adjacent equities, and broadly diversified portfolios heavy in large-cap US equities.
Millennials and Gen Z, by contrast, are net consumers of energy (commuting, heating, transportation) rather than net owners of energy production. They hold far lower 401(k) balances proportionally — meaning market volatility hits them harder on a percentage basis and they have less cushion to ride out a war-induced drawdown. They’re also the generation paying the most in gas as a share of income and the generation whose mortgage rates just got structurally harder to cut because a war created inflationary pressure the Fed has to monitor.
The defense contractor windfall is similarly age-skewed. Institutional investors — pension funds, endowments, Boomer-era 401(k) millionaires — hold the bulk of Lockheed, RTX, and Northrop Grumman shares. When Northrop Grumman jumps 6% in a day, the biggest beneficiaries are the people who had the wealth to hold significant equity positions in defense companies to begin with. That demographic skews heavily Boomer.
This is the pattern that 43 presidents have run for decades: the generation in power starts the war, the defense industry profits, the younger generation pays the debt, the gas bill, and the inflation tax. Operation Epic Fury is not an anomaly. It is the template.
The Counter-Argument: “War Was Necessary for Security”
The standard rebuttal to this analysis is that the economic costs are secondary to genuine national security imperatives — that Iran’s nuclear program, missile arsenal, and regional proxy network represented a real and present threat that had to be addressed regardless of the economic fallout. Trump launched the war citing the need to “eliminate imminent threats” to the American people.
This argument has genuine weight. Iran’s weapons-grade uranium stockpile — the IAEA confirmed 200kg of 60%-enriched uranium still stored at Isfahan as of March 9 — was real. Its proxy militia network across Lebanon, Yemen, Iraq, and Syria was real. The threat calculus was not fabricated.
But the counter-argument has a structural problem: the people who bore the economic costs of this war — working-class Americans paying $4.50 at the pump, Millennials watching their 401(k)s shrink, the 92,000 workers who lost jobs in February — had no meaningful vote on whether that threat was worth $210 billion in economic damage, $891 million per day in military operations, and a generation’s worth of added national debt. The decision was made by a political class that was, overwhelmingly, not personally exposed to the costs. The military class divide isn’t abstract — it’s the lived experience of who serves, who profits, and who just pays.
Security and economic fairness are not mutually exclusive. But pretending the costs were distributed equitably is simply false.
Frequently Asked Questions
Who profited most from the Iran war economically?
Defense contractors — particularly Lockheed Martin (+40% since January 2026), RTX/Raytheon (+4.7% on day one), and Northrop Grumman (+6%) — were the clearest financial beneficiaries. Energy companies including Valero (+25.95%) and Exxon Mobil (+9%) also saw significant gains as oil prices surged.
How much did the Iran war cost ordinary Americans?
Directly through defense spending: $891.4 million per day in military operations, with a total economic cost estimated at up to $210 billion by the Penn Wharton Budget Model. Indirectly: gas prices spiked $0.43/gallon in the first week, the economy lost 92,000 jobs in February, and stock market volatility hit 401(k) accounts as oil briefly reached $119/barrel.
Did the Iran war cause inflation in 2026?
It significantly increased inflationary risk. Oil at $100+ per barrel, Hormuz shipping disruptions, fertilizer prices spiking 25%, and LNG supply removal via Qatar’s force majeure all create pass-through inflation across consumer goods, food, and utilities. The Federal Reserve was watching the war closely, as it complicated the rate-cut trajectory that workers needed to relieve mortgage and borrowing costs.
Is the Iran war “over” as Trump claimed on March 9?
As of March 9, Trump told NBC News the war was “very complete, pretty much” — but the same day Iran fired fresh drones and missiles at Gulf countries, IDF struck six Iranian military airfields, and Lebanon’s death toll rose to 486+. The fighting had not stopped; the political signaling had started. Whether that translates to an actual cessation of hostilities — and the economic relief that would follow — remained unclear.
Sources & Methodology
Financial and economic data sourced from: Penn Wharton Budget Model via Fortune, CSIS via CNN, Responsible Statecraft defense stock analysis, Forbes defense contractor reporting, NBC News economic impact analysis, Reuters shipping cost data, CNBC jobs report analysis, AP oil market reporting. Trump’s “pretty much complete” quote sourced from India Today/NBC News reporting March 9, 2026. Iran FM Araghchi quote from direct X post, March 9, 2026. IAEA uranium stockpile data from IAEA Director General Grossi remarks March 9, 2026. Generational wealth data from Federal Reserve Distribution of Financial Accounts (DFA). Energy burden statistics from Lawrence Berkeley National Laboratory Low-Income Energy Affordability Data Tool.