 ByAiden
Why Is Car Insurance So Expensive? The $169 Billion Profit Hiding Inside Your Premium
Share your love
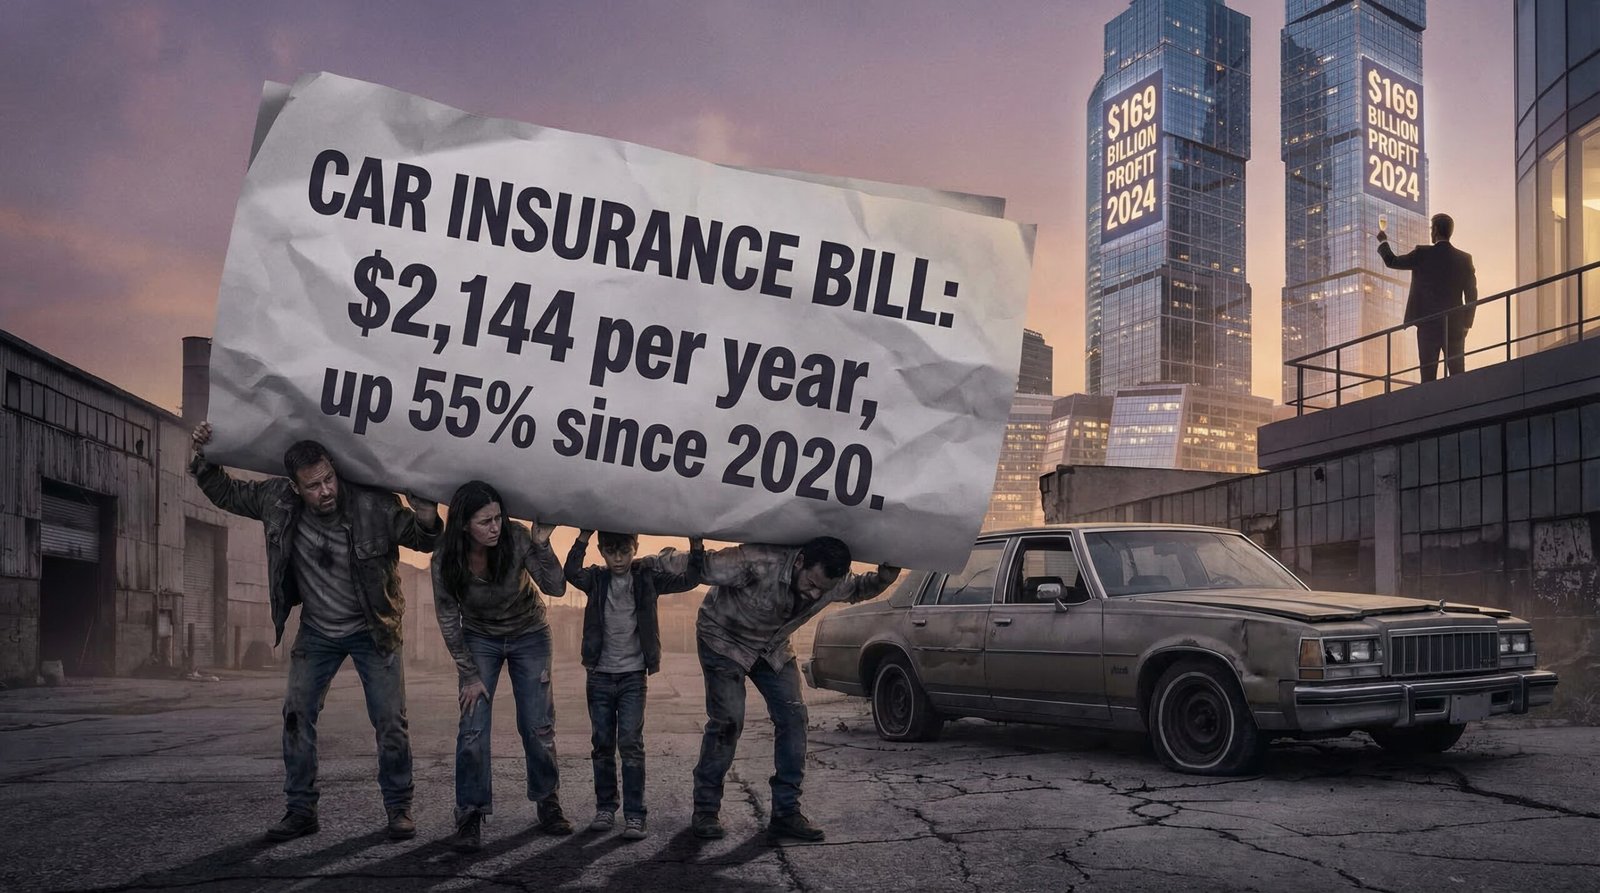
Car insurance in America is now 55% more expensive than it was in 2020 — and the steepest increases came between 2022 and 2024, when premiums rose at the fastest pace in half a century. The average full-coverage policy costs $2,144 per year in 2025, up from roughly $1,380 in early 2020. For a household earning $40,000, mandatory car insurance now consumes 10% of gross income. While the industry points to genuine cost pressures — more expensive cars, pricier repairs, rising medical bills — the same industry reported a record $169 billion in net profit in 2024, up 91% from 2023 and 330% from 2022. That math doesn’t add up to an honest price adjustment. It adds up to a captive market getting extracted.
Key Takeaways
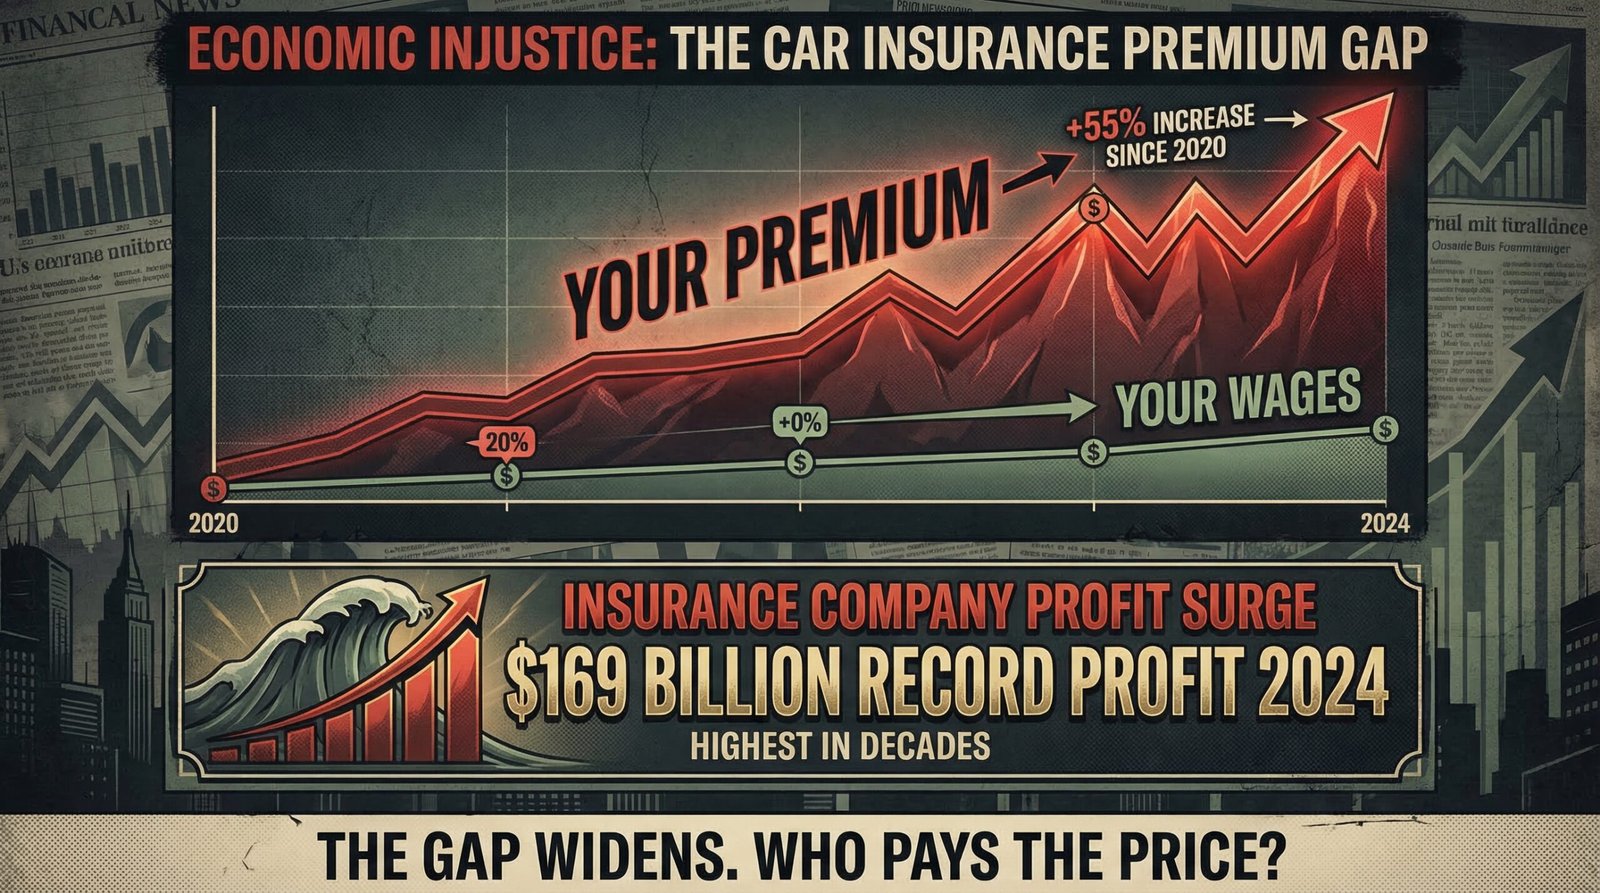
- Car insurance premiums are up 55% since February 2020, with nearly all of that increase coming between 2022 and 2024 — the steepest multi-year surge in half a century, according to the Bureau of Labor Statistics CPI for motor vehicle insurance. Average monthly premiums climbed from $140 in 2022 to $209 in 2025.
- The insurance industry posted a record $169 billion in net profit in 2024 — up 91% from 2023 and 330% from 2022 — while simultaneously raising premiums, non-renewing policies, and lobbying against consumer protections. Insurance CEOs received 27% salary and bonus increases during the same period consumers faced historic premium hikes.
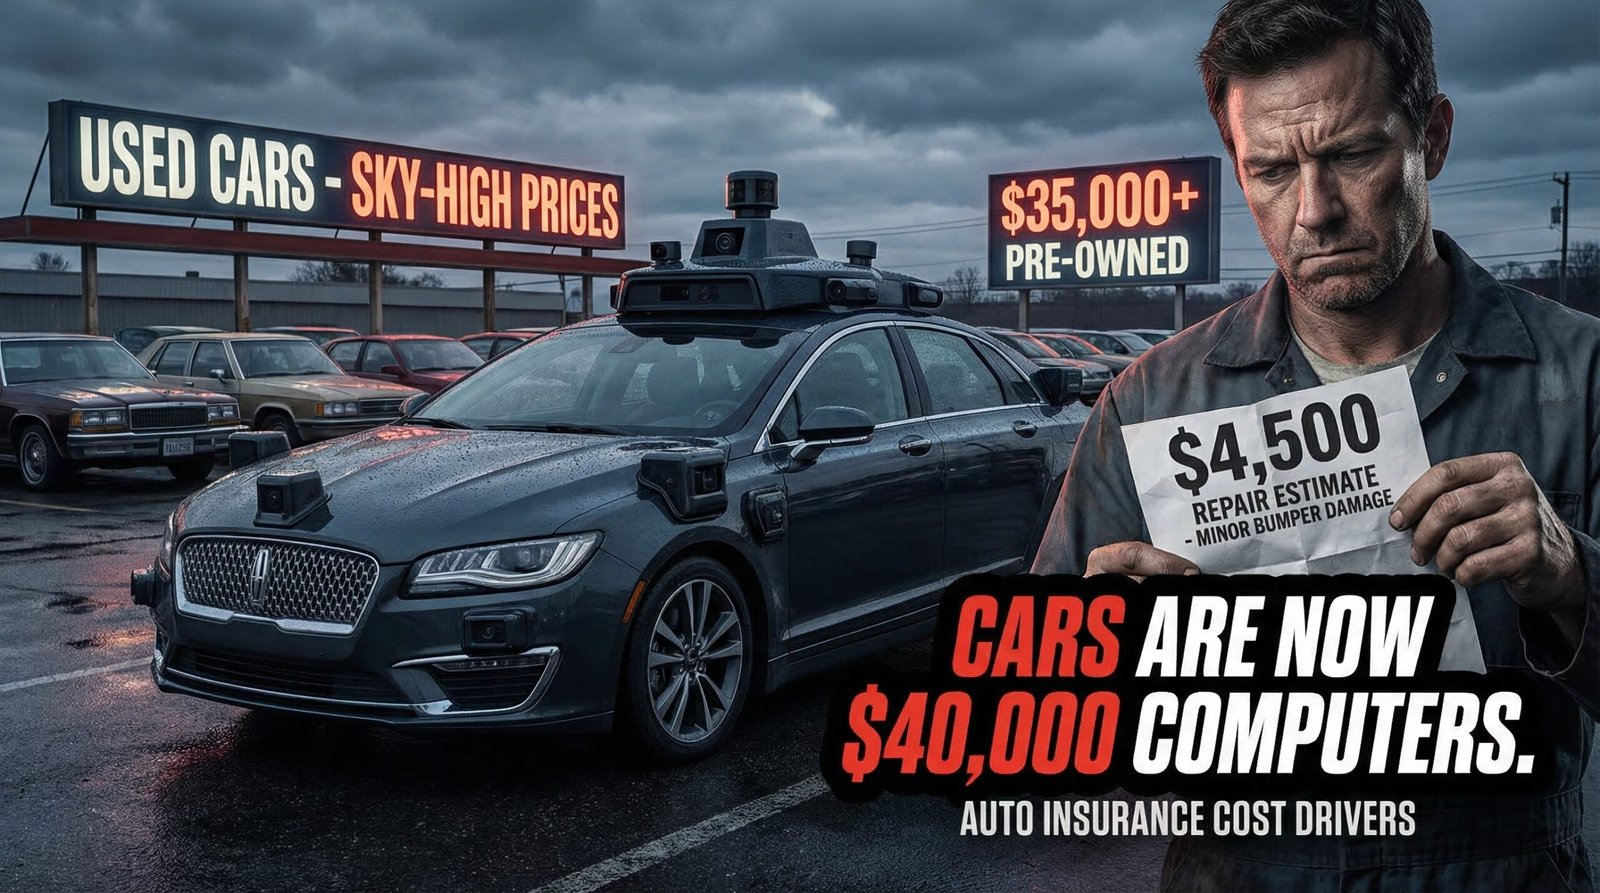
- Modern vehicles are increasingly expensive to repair: ADAS sensors, cameras, radar modules, and electronic components can cost $1,500–$3,000 to replace on what would once have been a minor fender-bender. Medical costs following auto accidents rose 7–8% annually from 2023 to 2024. Used car prices remain elevated post-pandemic, meaning total-loss payouts are higher. These are real cost drivers — but they explain the increase, not the profit surge layered on top.
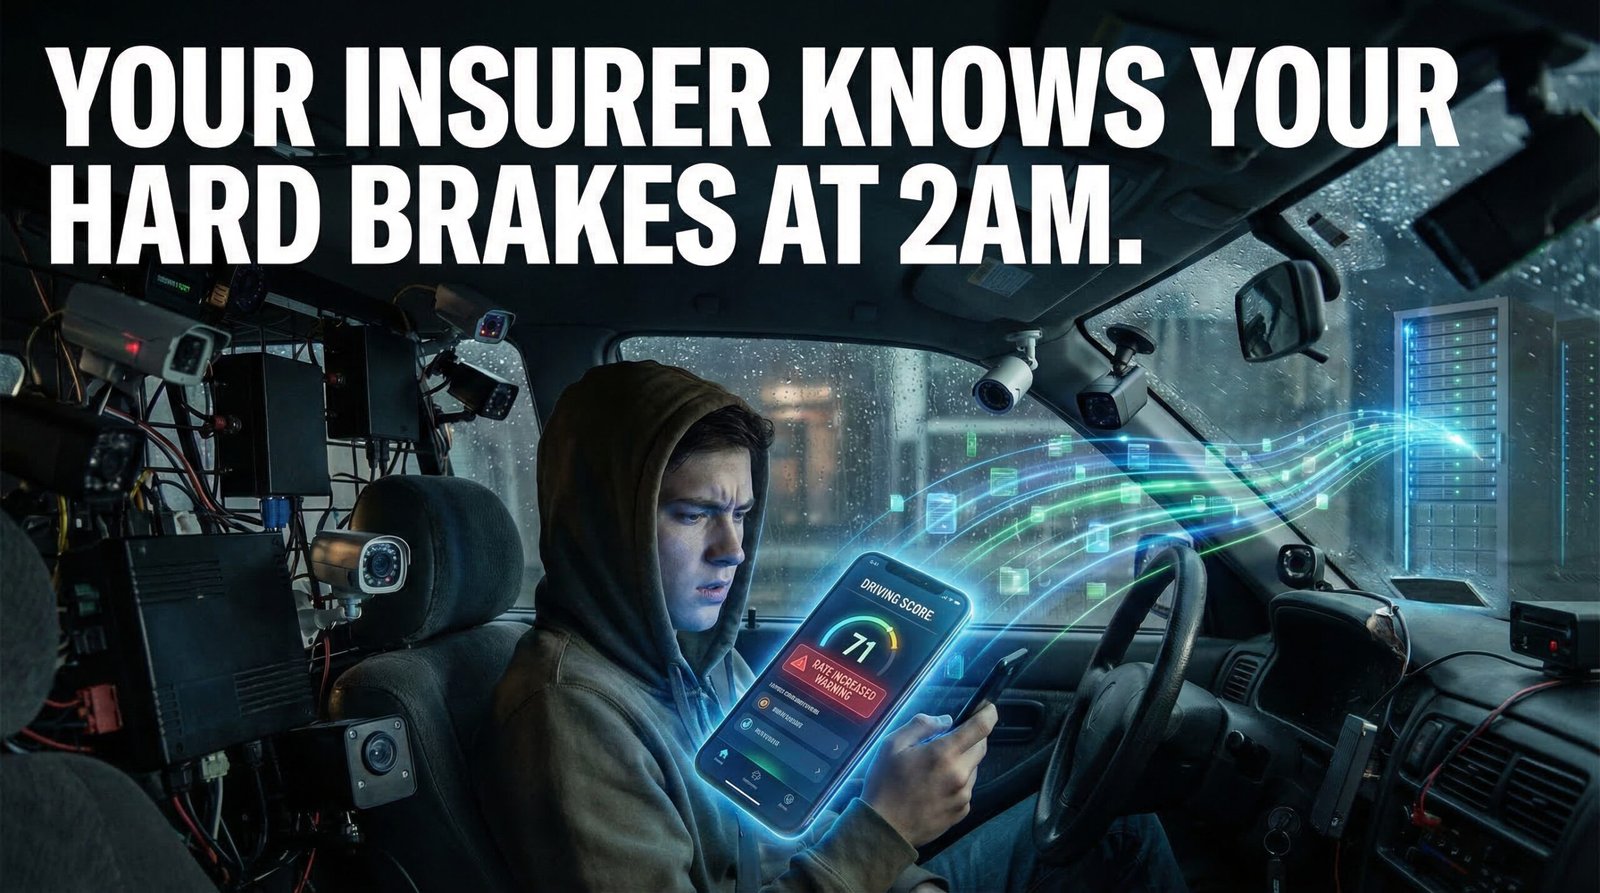
- Telematics surveillance — usage-based insurance programs like Progressive’s Snapshot, State Farm’s Drive Safe & Save, and Allstate’s Drivewise — now monitors braking, speed, time of driving, and in some cases location for tens of millions of drivers. Consumers who opt in hoping for discounts frequently end up with rate increases instead. The data is collected permanently, shared with subsidiaries, and in some cases integrated with vehicle OEM data streams the driver never opted into.
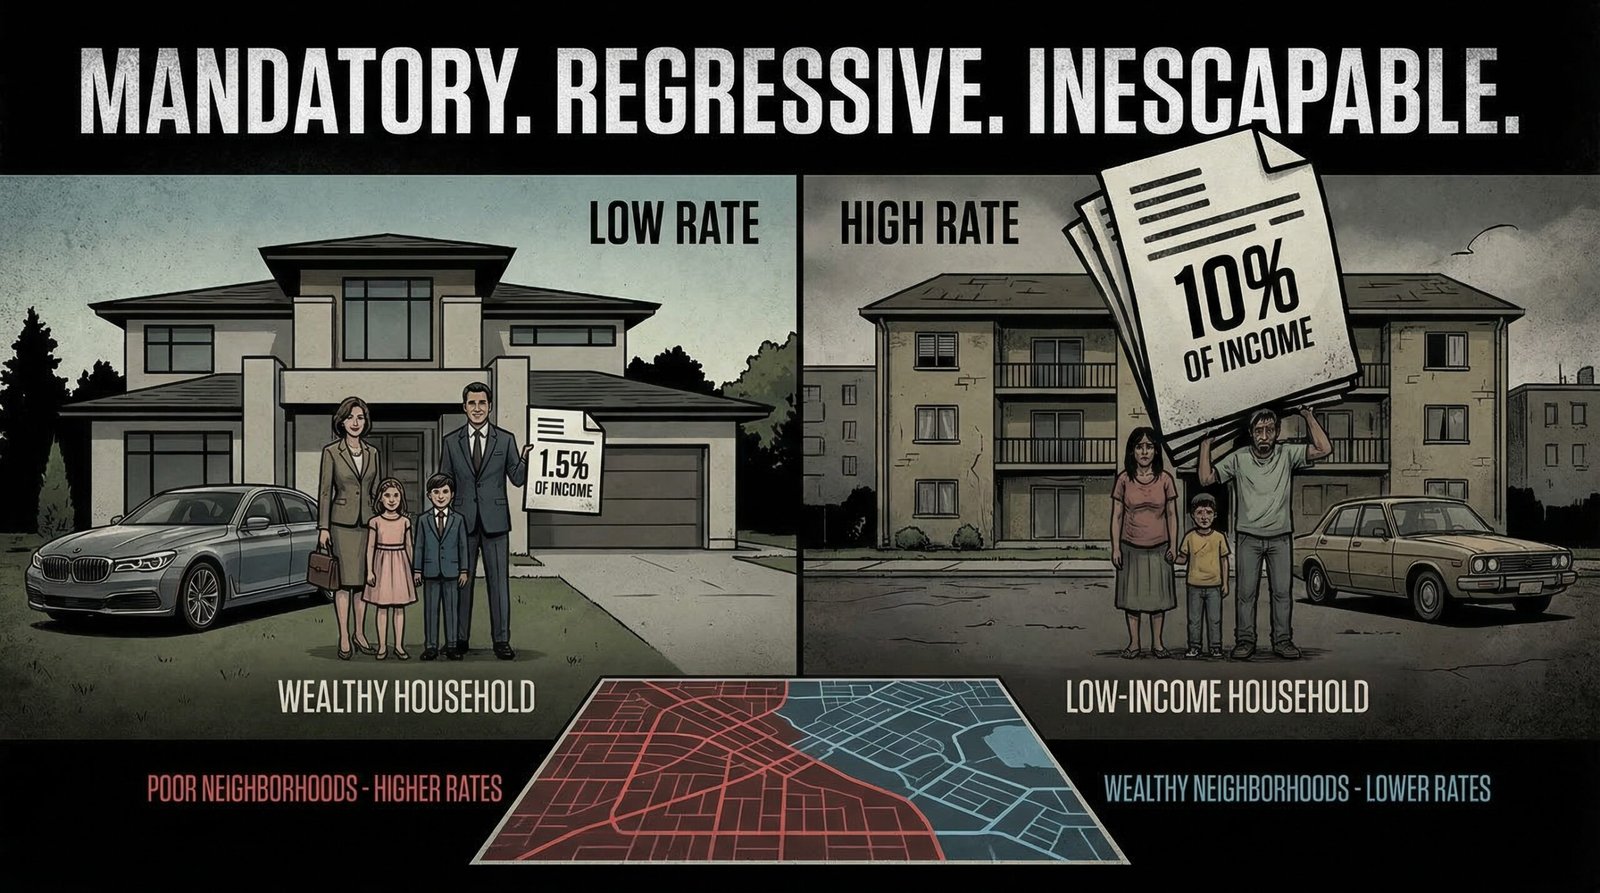
- Car insurance is structurally regressive: it is mandatory in 49 states, yet its cost as a percentage of income rises sharply as income falls. A household earning $40,000 spends approximately 10% of gross income on mandatory car insurance. Zip-code-based pricing means low-income urban drivers in predominantly minority neighborhoods pay significantly higher rates than suburban drivers with identical driving records — a practice that consumer advocates call “bluelining,” the algorithmic successor to redlining.
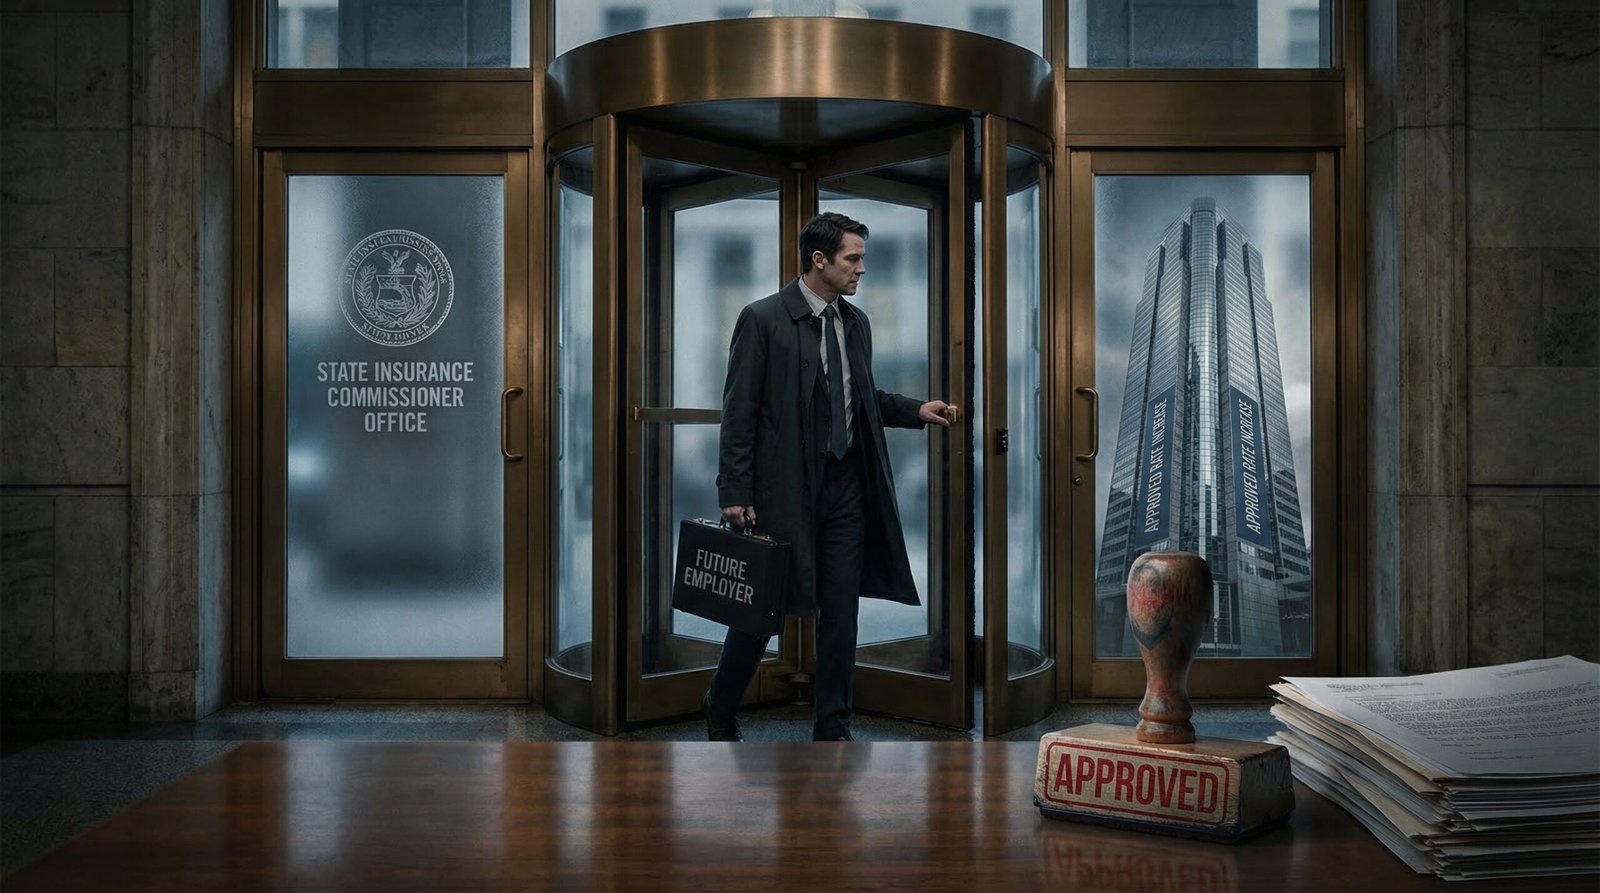
- State insurance commissioners — the officials who approve or deny rate increases — are elected or appointed officials with deep ties to the insurance industry they regulate. The revolving door between state commissioner offices and industry is well-documented. California’s Proposition 103, passed in 1988, is the only major state law that requires voter-driven premium rollbacks — and the industry has spent decades litigating against it. In most states, a “rate filing” is submitted and approved with minimal meaningful scrutiny.
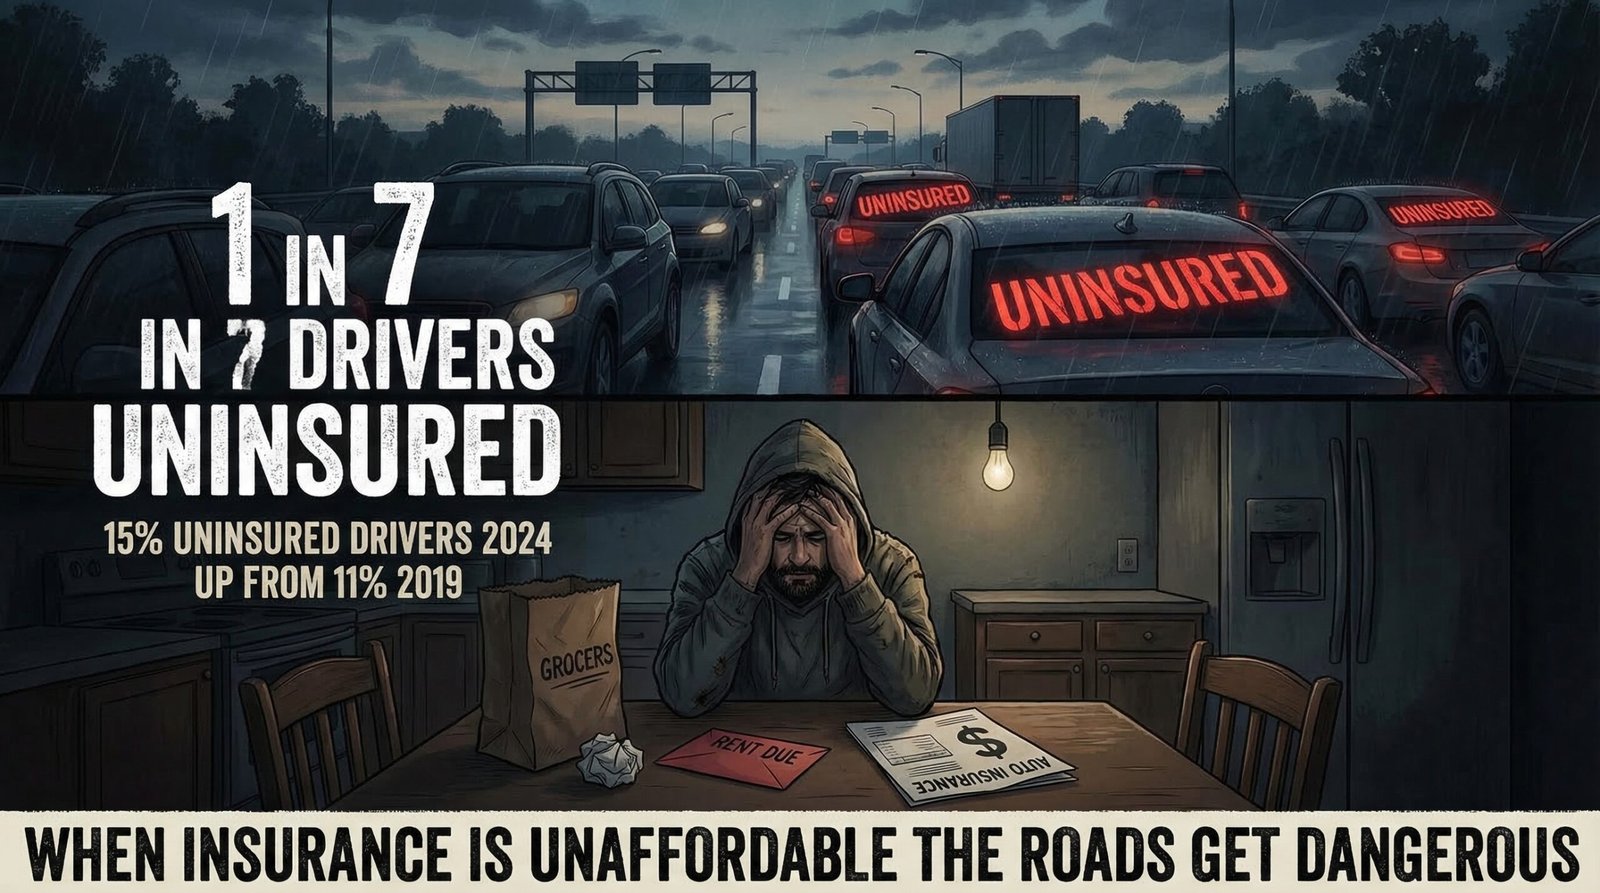
- The uninsured driver rate has risen to 15.4% in 2023 — one in seven drivers — up from roughly 11–12% a decade ago, and up from 13% in 2019. One in three drivers is now either uninsured or underinsured, according to the Insurance Research Council. When uninsured drivers cause accidents, costs are passed to insured drivers through uninsured motorist coverage and premium adjustments — creating a vicious cycle where affordability failures raise rates for everyone else.
Why Did Car Insurance Go Up 55% Since 2020?
The BLS CPI for motor vehicle insurance hit +55% compared to February 2020 by early 2025 — the steepest multi-year premium surge in 50 years. The increases were not evenly distributed: rate hikes of 15%+ per year in 2022 and 2023 were approved in state after state, even as the industry was absorbing genuine post-pandemic cost shocks. Several distinct forces drove the increase — but the timing and magnitude of insurer profits suggest the industry used real cost pressures as cover for margin expansion that went significantly beyond cost recovery.
The COVID underpricing hangover. During 2020 and 2021, insurance companies collected premiums but paid far fewer claims — lockdowns meant fewer miles driven, fewer accidents, and dramatically reduced claim frequency. Rather than setting aside the windfall for future volatility, many insurers returned some to shareholders and kept premium rates artificially low to retain customers. By late 2021, as driving resumed and claim costs surged, the industry found itself underpriced — and began a multi-year overcorrection that produced the steepest increases in a generation. The Wall Street profit extraction logic that drives fee structures in retirement accounts applies equally to insurance: the gap between what you pay and what the math requires is pure margin, until it isn’t.
Post-pandemic driving behavior shift. Empty roads during COVID encouraged speeding and reckless driving. Those patterns persisted. By 2022–2023, crash severity had increased measurably: the average injury severity per accident was higher, and large-verdict “nuclear verdict” lawsuits — driven partly by what the industry calls “social inflation” — were pushing claim costs beyond actuarial projections. Commercial auto insurance has posted an underwriting loss for 14 consecutive years. Personal auto recovered profitability only after the 2022–2024 rate hikes.
Geographic concentration of losses. Florida, California, and Texas — the three largest auto insurance markets by premium volume — experienced acute crises. Florida’s insurance market has been destabilized by hurricane losses, assignment-of-benefits litigation abuse, and over a dozen insurer insolvencies since 2020. Florida accounts for 79% of all homeowner insurance litigation in the country, and the volatility bleeds into auto. California’s heavily regulated market (Proposition 103) created approval backlogs, leading major insurers to limit new policy issuance. The result: less competition, higher prices for drivers who can’t easily switch.
Record profit during “necessary” increases. The industry’s own numbers undermine the “we had no choice” narrative. P&C insurers wrote $926 billion in premiums in 2024, up from $851 billion in 2023 — and posted $169 billion in net income while doing it. That’s not a company absorbing losses. That’s a company that raised prices faster than costs rose, captured the spread, and paid it to shareholders and executives. The American Association for Justice documented the pattern in July 2025: “The insurance industry is quietly making record profits” while simultaneously pushing legislation to cap lawsuit damages, limit claims obligations, and weaken consumer protections. The same playbook used to gut the CFPB — capture the regulator, lobby against consumer recourse — runs through the insurance industry’s political strategy.
How Are Cars Getting More Expensive to Repair?
Modern vehicles are rolling computers. A 2024 mid-range sedan may contain over 100 sensors, multiple LIDAR or radar modules for collision avoidance, front and rear cameras, lane-departure systems, and an adaptive cruise control array that can cost $1,500–$3,000 to replace after a minor front-end impact. A bumper fender-bender that would have been a $800 body shop repair on a 2005 Honda Accord is now a $4,500–$6,000 repair on a 2023 Toyota Camry with a front-facing camera and radar sensor embedded in the grille. This is real. It is a legitimate driver of insurance cost increases.
Automakers have been adding these systems in part because federal safety mandates (NHTSA) and insurance rating incentives pushed toward their adoption. The irony: ADAS features are designed to prevent accidents — and statistically they do. But when an ADAS-equipped car does get into an accident, even a minor one, the repair bill is two to three times higher than it would have been on a vehicle without those systems. The average vehicle transaction price reached $48,759 in late 2023, down only slightly from the 2022 peak — meaning total-loss payouts are higher, driving up comprehensive and collision premiums.
Medical inflation compounds the problem. Auto insurance pays not just for vehicle damage but for bodily injury claims. First-party medical bill severity rose 7–8% annually from Q4 2023 to Q4 2024, according to CCC Intelligent Solutions data. Healthcare in America costs more than anywhere else in the world — and those costs are baked into every auto insurance injury claim. The prescription drug price crisis, private equity hospital consolidation, and the general inflation of American healthcare don’t just hit your health insurance premium — they hit your car insurance premium too, because every ER visit following an accident is part of the insurance company’s cost basis.
Parts shortages and labor costs have also contributed. The semiconductor shortage that drove new car prices to all-time highs in 2021–2022 cascaded into repair costs: OEM parts for ADAS-heavy vehicles are not interchangeable with aftermarket parts the way older components were, repair labor for calibrating sensors requires certified technicians, and the shortage of certified collision repair shops relative to demand has kept labor rates elevated. None of this is the consumer’s fault. But the consumer is paying for all of it — while the companies collecting those payments post record profits.
What Is Telematics — and Why Is Your Insurer Surveilling Your Driving?
Usage-based insurance (UBI) via telematics — driving behavior monitoring programs — has exploded in adoption since 2020. Progressive’s Snapshot, State Farm’s Drive Safe & Save, Allstate’s Drivewise, Nationwide’s SmartRide, and dozens of smaller programs collectively monitor tens of millions of American drivers. The pitch: let us track your driving, and if you’re safe, you’ll save money. The reality is more complicated.
Telematics devices — either a dongle plugged into the OBD-II port or a smartphone app — typically monitor:
- Hard braking events (deceleration above a threshold — penalized even when caused by other drivers’ behavior)
- Rapid acceleration
- Speed (often compared against posted limits, which may not match actual road conditions)
- Time of day (late-night driving is penalized even for shift workers or nurses who have no choice)
- Phone use while driving (in newer app-based programs)
- Mileage
The data is collected continuously, scored algorithmically, and used to adjust premiums. The problem: drivers who sign up hoping to qualify for discounts frequently discover their scores are penalized for factors outside their control — braking hard to avoid a sudden road hazard, driving at 11pm for a night-shift job, living in a zip code with stop-and-go traffic that artificially inflates braking metrics. A 2025 Illinois state investigation found that telematics programs can discriminate by geography in ways that correlate with income and race — even without explicitly using those variables. The same digital-redlining pattern documented in credit scoring is being replicated in insurance telematics.
Meanwhile, a separate and more alarming data stream is emerging: new vehicles themselves collect and transmit driving data through their OEM telematics systems — and in some cases, that data is being sold to data brokers and acquired by insurance companies without the driver’s explicit knowledge. A 2024 investigation found that multiple automakers were sharing granular driving data with LexisNexis and Verisk — two data analytics companies that supply insurance risk scoring models — without drivers realizing their cars were surveillance devices. The data wasn’t from an opt-in app. It was from the car itself. This practice is the subject of ongoing FTC scrutiny as of early 2026.
Who Gets Hit Hardest? The Regressive Math of Mandatory Car Insurance
Car insurance is mandatory in 49 states. You cannot legally drive to work, take your child to the doctor, or do anything that requires a car without purchasing it. Unlike most expenses, there is no legal opt-out. This makes car insurance structurally different from other consumer costs — it is effectively a tax, one that is collected by private corporations with a profit motive and approved by state regulators with a revolving door to industry.
As a share of income, auto insurance is deeply regressive:
- Household earning $200,000+: $2,144/year = approximately 1.1% of income
- Household earning $60,000: $2,144/year = approximately 3.6% of income (and rises to ~7% in high-cost states)
- Household earning $40,000: $2,144/year = approximately 5.4% of income nationally; up to 10% in states like New York or Louisiana
The burden intensifies through credit-based insurance scoring. Most states allow insurers to use credit scores as a pricing factor — meaning a driver with poor credit (often a product of medical debt, student loan defaults, or periods of unemployment) pays dramatically more than a driver with identical driving history but better credit. In New York, drivers with poor credit pay an average of $7,590 per year — 88% more than drivers with good credit. An 18-year-old male in New York faces average premiums of $9,901 — nearly 3x the national average. Young drivers are statistically higher risk, but the magnitude of the age penalty is not purely actuarial: it also reflects the fact that young drivers have shorter credit histories, less negotiating leverage, and fewer alternative options.
Zip-code-based pricing compounds the injustice. Insurance companies have historically priced by geography under the actuarial rationale that certain areas have higher claim frequency, theft rates, or accident rates. In practice, this means that a low-income driver in a dense urban zip code — which correlates with minority demographics — pays significantly more than a suburban driver with an identical record. Consumer advocates at the Consumer Federation of America have documented this pattern and called it “bluelining” — the digital heir to the racially discriminatory redlining practices of the 20th century that locked Black Americans out of homeownership. The racial wealth gap built by those original policies is being reinforced through algorithmic insurance pricing today.
Why Don’t State Regulators Stop the Price Gouging?
Insurance in America is regulated at the state level — a system established by the McCarran-Ferguson Act of 1945, which explicitly exempted the insurance industry from most federal antitrust law and delegated oversight to states. Every state has an insurance commissioner whose job includes reviewing and approving (or rejecting) rate filings. In practice, meaningful rate suppression is rare. There are structural reasons for this.
The revolving door. State insurance commissioners are either elected (in 11 states) or appointed by the governor. Both paths create industry capture. Appointed commissioners are often drawn from the industry they regulate, and many go back to industry roles after their tenure. The actuarial and legal staff needed to meaningfully evaluate complex rate filings — which involve thousands of pages of loss modeling, reinsurance cost documentation, and statistical projections — is expensive to maintain at the state level. Industry employs far more actuaries with far better data than the regulators reviewing their filings. The information asymmetry is structural and intentional.
The “inadequate rates” threat. Insurance companies use a powerful regulatory leverage point: if rates are not approved, they will exit the market. This is not always a bluff. State Farm stopped writing new homeowners policies in California in 2023. Farmers limited its California exposure. A dozen Florida auto and homeowners insurers went insolvent or withdrew between 2020 and 2023. When insurers exit, the state’s insurer of last resort (California FAIR Plan, Florida Citizens, etc.) absorbs customers at even higher rates with fewer protections. Commissioners who push back hard on rate increases face the political liability of insurers leaving their state. This creates a structural pressure to approve rather than deny.
The exception that proves the rule: California Prop 103. California’s Proposition 103, passed by voter initiative in 1988, requires that auto and homeowners insurance rate increases above 7% receive prior approval from the commissioner — and allows consumer intervenors to challenge rate filings in public hearings. The result: California has consistently lower average auto insurance rates than comparably sized states, and the commissioner has rejected or reduced multiple attempted increases. The industry has spent decades litigating against Prop 103, suing to limit intervenor rights, and attempting legislative rollbacks. It remains the most meaningful consumer insurance protection in the country precisely because it was passed by voters, not legislators subject to industry lobbying. The revolving door that operates in federal financial regulation operates identically at the state insurance level — just with less scrutiny.
What Happens When Car Insurance Becomes Unaffordable?
When mandatory insurance becomes unaffordable, people drive without it. The data is clear: the uninsured driver rate has risen to 15.4% in 2023 — one in seven drivers — up from 11–12% a decade ago. One in three drivers is now either uninsured or underinsured, according to the Insurance Research Council. In Mississippi, the uninsured rate rose 6 percentage points in a single year (2022 to 2023), reaching 28%.
This creates a systemic doom loop. When an uninsured driver causes an accident, insured drivers absorb the cost through their uninsured motorist (UM) coverage — which is a premium add-on on their own policy. More uninsured drivers = higher UM claims = higher UM premiums = more people dropping coverage = more uninsured drivers. The insurance industry’s pricing decisions are directly creating the uninsured driver problem they then use to justify further rate increases.
The mobility consequences are severe. In most of America, a car is not optional. Public transit coverage outside of a handful of major cities is inadequate for work commutes, childcare logistics, grocery access, and healthcare. Driving without insurance is illegal and carries significant penalties — fines, license suspension, vehicle impoundment — that disproportionately devastate low-income workers who have no alternative way to get to work. The same policy environment that requires work to receive benefits also prices out the transportation those work requirements depend on. It is a perfect policy trap, built by people for whom $2,144 per year is an invisible line item, imposed on people for whom it is a genuine crisis.
Several states have created low-income auto insurance programs (California’s CLCA program offers minimum-liability coverage for about $400/year to income-qualifying drivers), but enrollment is chronically low due to awareness gaps and eligibility restrictions. The federal government has no mandatory car insurance subsidy program comparable to ACA subsidies for health insurance. The CFPB’s gutting in 2026 eliminated one of the few federal entities monitoring auto insurance discrimination practices.
The Counter-Argument: Real Costs Drove Real Increases
The insurance industry’s defense is not entirely fabricated. Actuarial reality is real, and the 2022–2024 premium surge was at least partially driven by genuine cost factors that accumulated while premiums were held artificially low during COVID.
The strongest version of the industry argument: insurers operate on thin combined ratios, and a combined ratio above 100 means the company is paying out more in claims than it collects in premiums — the investment income on float is what makes the business model work. Personal auto insurance posted a combined ratio above 100 consistently from 2020 through mid-2023, meaning the industry genuinely lost money on underwriting during that period, even as overall P&C profitability was supported by investment returns and other lines. The 2024 profit surge reflected a return to underwriting profitability after multiple years of losses — it was, by this argument, the recovery cycle that actuarially follows a loss cycle.
Additionally, rate increases require regulatory approval in every state. If regulators approved double-digit increases, it means they reviewed the supporting actuarial data and found it justified. The market is not simply “charging whatever it wants” — there is a regulatory layer, however imperfect.
Where the counter-argument falls short: A 91% profit surge in a single year, on top of rates that were already elevated, is not cost recovery — it’s margin expansion. The industry did not simultaneously return windfalls to policyholders when profits surged; it kept them. CEO compensation at major insurers rose 27% in 2025. Insurance company stock buybacks and dividends accelerated. The gap between what the data says costs rose and what premiums rose is too large to be explained by actuarial necessity alone. And the systematic use of credit scores, zip codes, and telematics to price out low-income and minority drivers goes beyond risk modeling into structural discrimination that has nothing to do with whether someone will have an accident.
FAQ: Why Is Car Insurance So Expensive?
Why did my car insurance go up so much in 2024 even though I had no accidents?
Your personal driving record is only one factor in your premium. Insurers price based on statewide and regional loss experience — if claims in your state increased (due to severe weather, higher medical costs, more uninsured drivers, or litigation trends), your rate goes up regardless of your individual history. The 2022–2024 national rate surge hit virtually all policyholders simultaneously because the underlying cost factors were systemic, not individual. Additionally, most states allow insurers to increase rates by up to 6–7% without a formal rate hearing — meaning double-digit annual increases often arrive in two or three approved tranches rather than one visible jump.
Which states have the most expensive and cheapest car insurance?
As of 2025–2026, the most expensive states for full-coverage auto insurance are New York ($4,031/year average), Florida, Louisiana, Michigan, and Nevada — all states with high litigation rates, severe weather exposure, high uninsured driver rates, or (in Michigan’s case) a unique no-fault insurance system that historically paid unlimited lifetime medical benefits. The cheapest states are Iowa, Idaho, Vermont, South Dakota, and Wyoming — low-density, low-litigation, low-severity markets. If you live in an expensive state, the only meaningful ways to reduce premiums are to shop aggressively between carriers, raise your deductible, drop comprehensive/collision on older vehicles, and check eligibility for low-income programs like California’s CLCA.
Should I use a telematics program to lower my insurance?
Possibly — with clear-eyed expectations. Telematics programs can produce meaningful discounts (5–20%) for drivers who have short daytime commutes, smooth driving patterns, and live in lower-traffic areas. They are most beneficial for: retirees and part-time drivers, suburban/rural drivers with predictable routes, and people with clean records but elevated rates due to age or credit. They are most risky for: city drivers in stop-and-go traffic (hard-braking metrics will penalize you), shift workers or anyone who drives between 11pm and 5am (night driving penalties are common), and anyone concerned about their data being used beyond the stated purpose. Always ask: what data is retained after the program ends? Can the company use your score to raise rates at renewal? What third parties does the data get shared with? Many programs lack transparent answers to these questions.
Is there any federal regulation of car insurance prices?
No. The McCarran-Ferguson Act of 1945 established state primacy over insurance regulation and exempted the industry from most federal antitrust law. Congress has periodically considered federal minimum standards (particularly for health insurance prior to the ACA, and in response to post-hurricane insurance failures), but the insurance industry’s lobbying presence in state capitals — where regulatory approval of rate increases actually happens — is among the most powerful in any industry. The National Association of Insurance Commissioners (NAIC) coordinates between states but has no binding authority. Federal consumer protection agencies like the CFPB have limited jurisdiction over insurance products. There is no federal equivalent of the NHTSA’s vehicle safety standards that applies to insurance pricing practices. This regulatory gap is intentional — the industry fought for it in 1945 and has defended it ever since.
Sources & Methodology
Primary sources: Bureau of Labor Statistics CPI: Motor Vehicle Insurance Index — 55% increase since February 2020; Insurance.com: Why Is Car Insurance So Expensive? (Monthly premium $140 to $209, 2022–2025); Insurify: Auto Insurance Rates 2025 National Average $2,144; American Association for Justice: Insurance Industry Record Profits $169 Billion 2024; Revolving Door Project: P&C Profit $166.8B — up 91% from 2023 and 330% from 2022; Consumer Federation of America: Insurance CEO Pay 27% Increase vs Consumer Premium Hikes; Chamber of Progress: Priced Out of Mobility — NY insurance burden by income ($60K → 7%, $40K → 10%); David Christensen Law: Americans Spend 3.41% of Income on Car Insurance; CBS Austin / Insurance Research Council: 1 in 3 Drivers Uninsured or Underinsured; IRC 2023 Data: 15.4% Uninsured Driver Rate; US News: Mississippi Uninsured Rate 28% in 2023 (+6 points in one year); Bankrate: Medical Cost Inflation Driving Auto Insurance Rates — 7–8% first-party severity increase; NPR: Why Car Insurance Costs Have Soared (Oct 2025); Insurance Business Mag: State Farm 2025 Record Profit; Consumer Federation of America: From Redlined Maps to Algorithms — Bluelining Insurance Discrimination; Bankrate: States With New Minimum Car Insurance Requirements 2025 (CA, UT, NC, VA). Telematics OEM data sharing: NYT/Mozilla Foundation investigation 2024. California CLCA program: California Department of Insurance. McCarran-Ferguson Act: 15 U.S.C. §§ 1011–1015 (1945). Credit-score pricing disparity New York $7,590: Insurify 2025 state report.