
The pension vs 401(k) by industry divide in America is one of the starkest class fault lines in the modern economy: government workers, teachers, and utility employees still retire with guaranteed monthly income, while the 85% of private-sector workers left without a pension are expected to gamble their retirement on market returns they do not control and match rates their employers can cut any time. In 2026, only 15% of private-sector workers have access to a defined-benefit pension, down from 88% in 1975 — a deliberate, industry-by-industry demolition that enriched corporate balance sheets and left an entire generation without a retirement floor.
Key Takeaways: Only 15% of private-sector workers have a pension in 2026, compared to 86% of state and local government employees. The industries that kept pensions — government, utilities, education — are exactly the ones with strong unions, while sectors that eliminated them never had significant union density. The median 401(k) balance for Americans nearing retirement is $87,000, generating roughly $290/month in retirement income — less than a monthly car payment. The pension-to-401(k) switch transferred retirement risk from employers to workers, then Wall Street collected $30 billion a year in fees for managing the result.

The Numbers: How Many Workers Actually Have a Pension?
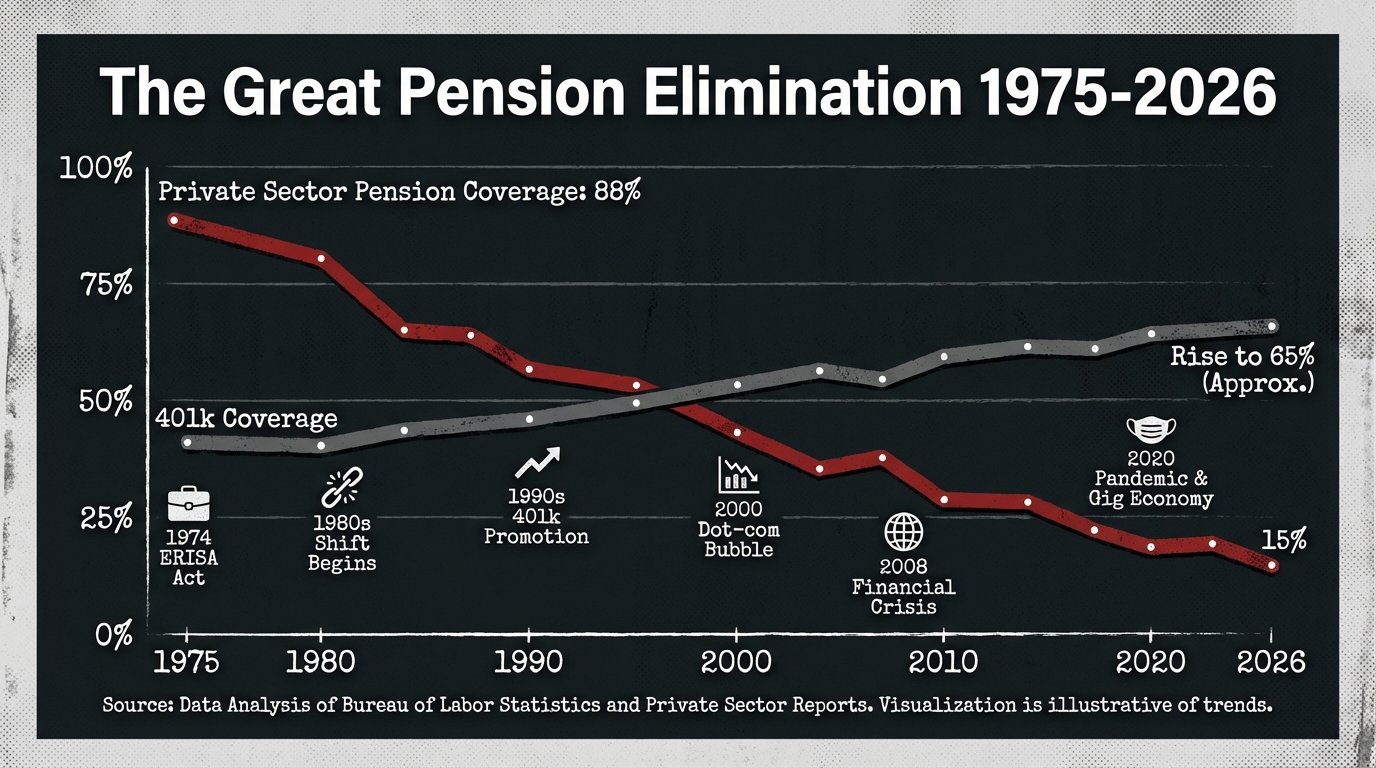
In 1975, the year the Employee Retirement Income Security Act (ERISA) was passed, 88% of private-sector workers with any retirement benefit had a defined-benefit pension. By 1990, that number had fallen to 60%. By 2000, it was 36%. Today, according to the Bureau of Labor Statistics 2025 National Compensation Survey, just 15% of private-sector workers have access to a defined-benefit pension plan, and the rate among workers earning under $35,000 per year is closer to 6%.
The public sector tells the opposite story. Among state and local government employees — teachers, firefighters, police officers, transit workers, social workers — pension access remains at 86%, virtually unchanged since 1980. Federal civilian employees participate in the Federal Employees Retirement System (FERS), a hybrid that includes a defined-benefit component. Military personnel receive full defined-benefit pensions after 20 years of service.
The result is a two-tier retirement system that maps almost perfectly onto who has collective bargaining rights and who does not. Government workers retire with a guaranteed monthly check that does not depend on whether the S&P 500 had a bad year. Private-sector workers — especially those in retail, food service, and gig work — retire with whatever their 401(k) produced after penalties and taxes, minus whatever market crash happened to hit two years before they needed the money. For context on just how underprepared most workers are, see the full analysis of the Millennial retirement savings crisis.
“In 1975, 88% of private-sector workers with retirement benefits had a defined-benefit pension. In 2026, that number is 15%. This was not economic evolution — it was a policy choice made by employers and enabled by Congress that transferred $3 trillion in retirement risk from corporate balance sheets onto workers shoulders.” — Economic Policy Institute, 2025 Retirement Security Report
Which Industries Still Offer Pensions in 2026

The industries that retained defined-benefit pensions share one characteristic: they either have strong union contracts, operate as regulated monopolies with stable cash flows, or both. The industries that eliminated pensions are exactly those where worker organizing collapsed in the 1980s and 1990s, often with direct government and corporate intervention.
Still Offering Pensions (Partial or Full)
- Government/Public Sector (86% pension access) — State, local, and federal employees. Teachers, firefighters, police, corrections officers, transit workers. Most plans provide 1.5%–2.5% of final salary per year of service.
- Utilities (72%) — Electric, gas, and water utilities negotiated strong union contracts in the mid-20th century. Regulated rate structures mean stable cash flows make pension funding predictable.
- K–12 and Higher Education (68%) — Teachers covered by state teacher retirement systems (TRS). Public university faculty often have pension or hybrid plans.
- Transportation and Warehousing (52%) — Unionized trucking, rail, and airline employees. The Railroad Retirement Board predates Social Security and remains a separate, more generous system for rail workers.
- Healthcare and Social Assistance (45%) — Hospital systems affiliated with government entities or major academic medical centers. However, the private equity wave in hospital ownership has been converting these plans to 401(k)s at an accelerating pace.
- Manufacturing (38%) — Heavily split between legacy union shops (auto, steel, aerospace) that retained pensions through UAW and USW contracts, and non-union facilities where pensions were eliminated entirely.
Pension-Free Industries in 2026
- Retail Trade (12%) — Only legacy union grocery chains retain pension access. Walmart, Target, Amazon, and virtually all non-union retail: no pension.
- Finance, Insurance, Real Estate (31%) — The industry that manages retirement assets for everyone else largely eliminated pensions for its own rank-and-file. Executive SERP pensions for C-suite remain common. The bank teller has a 401(k).
- Food Services and Accommodation (8%) — Restaurants, hotels, fast food. Virtually no pension access except at large unionized hotel chains.
- Professional Services / Tech (22%) — Law firms, consulting, technology companies. The dominant model is 401(k) with employer match.
- Gig Economy / Contract Work (0%) — Uber, Lyft, DoorDash, Instacart, and the entire independent contractor economy: no employer retirement contribution of any kind. Roughly 59 million Americans perform gig work; essentially none receive retirement benefits.
The 401(k) Gamble: How the Switch Transferred Risk to Workers

The 401(k) was created by accident. Revenue Act of 1978, Section 401(k), was a technical provision allowing employees to defer compensation into pre-tax accounts. Ted Benna, a benefits consultant, recognized in 1980 that companies could use it to create employer-matched savings plans — and corporations realized almost immediately that this was a mechanism for shifting retirement risk entirely off their balance sheets.
A defined-benefit pension is a liability. The employer must fund it regardless of investment performance, workforce changes, or quarterly earnings pressure. If the pension fund underperforms, the employer makes up the shortfall. A 401(k) transfers every one of those risks onto the worker. If markets underperform — as they did in 2000–2002, 2008–2009, and again in the 2026 market disruption — workers absorb the loss. The employer’s only obligation is to offer the plan and optionally match contributions, a match they can reduce or eliminate any time, as thousands of companies did in 2008, 2020, and 2025.
The shift generated enormous wealth for Wall Street. Managing 401(k) assets generates approximately $30 billion per year in fund management, plan administration, and investment product fees. A 1% annual expense ratio on a $100,000 account over 30 years costs approximately $76,000 in foregone compounding — roughly three years of contributions simply transferred to the fund manager. Most workers have no idea this is happening. For comparison on what early withdrawal from this system costs workers in crisis, see the full analysis of 401(k) early withdrawal penalties.
“The 401(k) was an accident of tax policy that corporations weaponized against their own workers. In 1980, it was a supplement to pensions. By 2000, it had replaced them. The result: employers saved trillions in pension obligations, Wall Street collected $30 billion a year in fees, and workers were handed a calculator and told to figure out their own retirement.” — Teresa Ghilarducci, Labor Economist, The New School
The Income Trap: Why 401(k)s Work for the Rich and Fail Everyone Else
The structural problem with the 401(k) system is that it works well only for workers who can afford to max it out consistently for 40 years — which means it works for high-income workers who least need the help, and fails systematically for those who need retirement security most.
According to the Federal Reserve’s 2025 Survey of Consumer Finances, the median 401(k) balance for workers aged 55–64 is $87,000. At a 4% safe withdrawal rate, that generates $3,480 per year, or $290 per month. The mean balance is around $312,000 — heavily skewed by high-income workers with maxed-out accounts — a statistic frequently cited to make the system look healthier than it is.
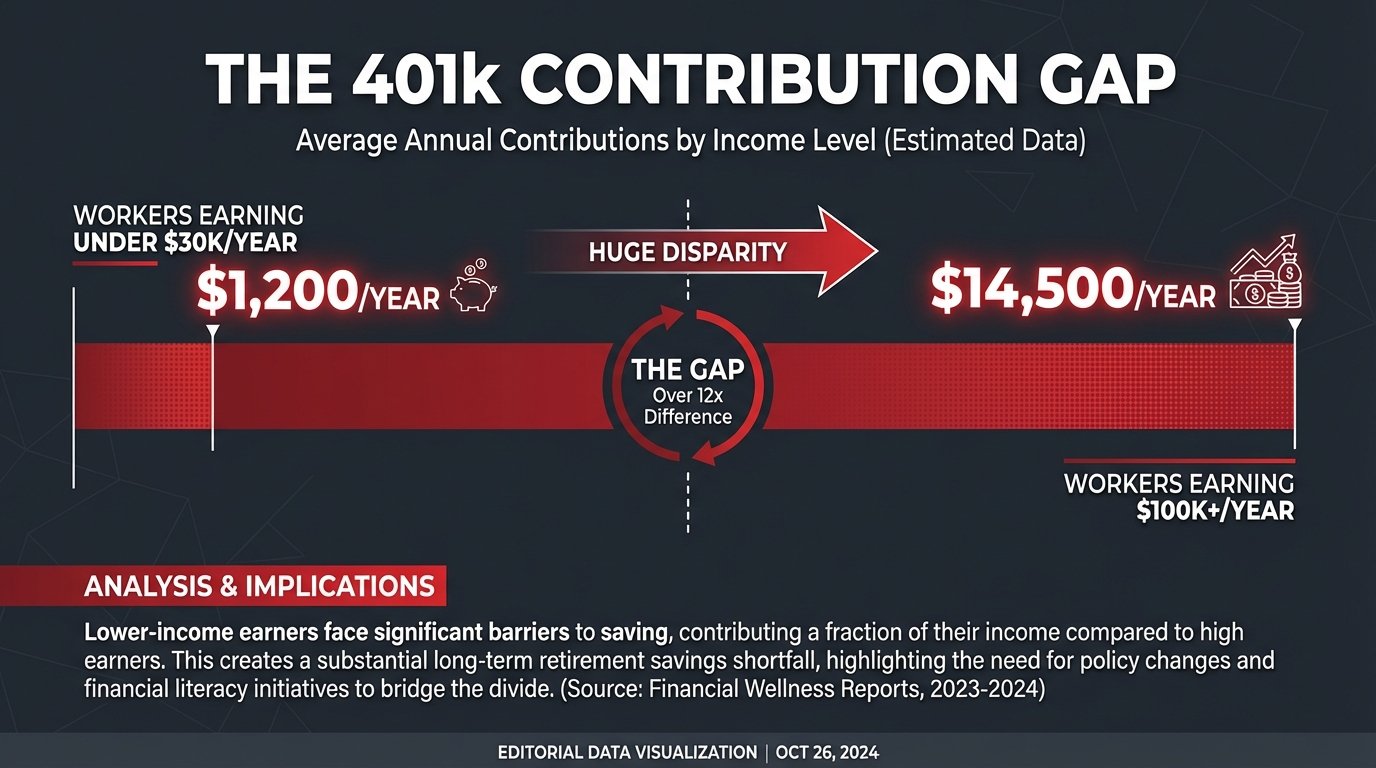
Workers earning under $35,000 per year contribute an average of $1,200 annually to their 401(k), according to Vanguard’s 2025 How America Saves report. Workers earning over $100,000 contribute an average of $14,500 — more than twelve times as much. The employer match amplifies this disparity: a 3% match on $35,000 is $1,050; a 3% match on $150,000 is $4,500. The tax deduction is worth more to higher earners in higher marginal brackets. Every structural feature of the 401(k) system produces larger benefits for people who were already financially secure.
For Millennials, the consequences are severe. Many entered the workforce during the 2008 financial crisis, missing peak early compounding years. Many spent their 20s in gig work with no employer retirement contribution. The median Millennial 401(k) balance is $49,000 — for workers averaging 36 years old who are supposed to retire in 30 years. The math does not work. Understanding the Roth IRA vs Traditional IRA tradeoff helps optimize what little is available, but optimization cannot substitute for the guaranteed floor that a pension provides.
Industry-by-Industry Breakdown: Who Won and Who Got Burned

The pension vs 401(k) by industry breakdown in 2026 tells a clear story: the workers who kept pensions are those whose industries had the political and organizational power to resist the switch. Everyone else got handed the risk.
Government Workers: The Last Protected Class
State and local government employees represent the clearest example of what a retirement system that actually works looks like. A teacher in California who spends 30 years in the classroom retires with approximately 60% of their final salary as a guaranteed monthly benefit, inflation-adjusted, for life. A New York City police officer with 22 years of service can retire at 50% of their final salary with full medical benefits. The underfunding problem in public pensions is real, but the fundamental structure — a guaranteed benefit that does not depend on market timing — works.
Auto and Aerospace: The Union Holdouts
UAW contracts at Ford, GM, and Stellantis retained defined-benefit pensions through the 2023 negotiations, though frozen for many workers. Boeing’s machinist union retained a pension for existing members but lost defined-benefit coverage for new hires in 2014 after Boeing threatened to move production out of Washington state. The aerospace story illustrates the dynamic precisely: when union density was high enough to credibly threaten production disruption, pensions survived. When employers could credibly threaten relocation, unions accepted the 401(k) as the price of jobs.
Retail and Food Service: The Pension Desert
Walmart employs approximately 1.6 million US workers. None have a defined-benefit pension. McDonald’s, with 150,000+ US employees in company-owned stores: no pension. Amazon warehouse workers: no pension. These three companies alone employ roughly 2 million Americans in jobs that will produce, in aggregate, retirement poverty for the vast majority of their workers.
Finance: The Industry That Knows Better
Perhaps the most revealing statistic in the pension vs 401(k) by industry analysis is that financial services — the industry that literally sells retirement planning products — eliminated defined-benefit pensions for its own workers while maintaining Supplemental Executive Retirement Plans (SERPs) for C-suite. At JPMorgan Chase, the CEO’s supplemental pension benefit is estimated at $60 million. The bank teller earns a 401(k) match of 5% of eligible compensation. The people who understand retirement risk most precisely designed a system that insulates them from it while selling the alternative to everyone else. This is the same revolving-door dynamic that produced the original 401(k) vs pension shift.
The Lobbying Campaign That Killed Your Pension
The elimination of private-sector pensions was the result of a sustained, coordinated lobbying effort by the Business Roundtable, the Chamber of Commerce, and the financial services industry to reshape the regulatory and tax incentive structure around 401(k)s.
ERISA’s 1974 passage was initially celebrated as worker protection: it established vesting schedules, funding minimums, and the Pension Benefit Guaranty Corporation (PBGC). But ERISA’s funding requirements also made pensions expensive and transparent in their obligations, creating corporate incentive to eliminate them. The Revenue Act of 1978’s 401(k) provision gave corporations a way out.
The mutual fund industry recognized immediately that 401(k)s represented an enormous new market for asset management fees. Fidelity, Vanguard, and Merrill Lynch lobbied aggressively through the 1980s for regulatory changes that made 401(k) administration easier and more profitable. The Department of Labor’s ERISA Advisory Council, stacked with financial industry representatives, issued guidance that consistently favored the defined-contribution model.
By the time Congress passed the Pension Protection Act of 2006 — supposedly the landmark pension reform legislation — the shift was essentially complete. The PPA’s most consequential provision expanded automatic enrollment in 401(k)s, making it easier for companies to count workers as “covered” by a retirement plan while maintaining zero guaranteed benefit obligation. The result: Social Security now functions as the de facto pension system for the majority of American workers, supplemented by 401(k) balances that, for the median worker, provide roughly three years of retirement income before running out. Workers dependent on Social Security Disability face an even more precarious situation if their 401(k) is depleted by a health crisis.
The Counter-Argument: Were 401(k)s Actually Better?
The standard defense of the 401(k) system contains several arguments worth examining seriously.
“401(k)s gave workers portability that pensions did not”
True, but incomplete. Defined-benefit pensions were notoriously difficult to carry between employers — the patchwork of different state and corporate systems rarely coordinated. A worker who changed jobs every five years often lost pension credit or received fractional benefits from multiple plans. The 401(k)’s portability is a genuine structural advantage. However, portability only matters if there are meaningful assets to port. A worker who spent their 20s in gig work does not have a 401(k) portability problem; they have a 401(k) participation problem.
“Markets outperform pension fund returns over long periods”
For high-income workers who can invest consistently and did not panic-sell in 2008 or 2020, this is sometimes true. But the premise requires consistent maximum contribution capacity over 43 years, no early withdrawals for emergencies, no market timing errors, and the good fortune to retire at a market high rather than a market crash. The stagflationary environment of 2025–2026 demonstrates exactly the sequence-of-returns risk that actuaries who designed defined-benefit systems understood.
“Public pensions are underfunded and unsustainable”
Partially true — the aggregate $1.3 trillion in public pension underfunding is a real crisis that younger taxpayers will be required to help resolve. But the appropriate response to underfunded pensions is to fund them adequately, not to use their fiscal problems as justification for eliminating the guaranteed-benefit model entirely from the private sector. Public pension underfunding is primarily a failure of political will to make required contributions — not a failure of the defined-benefit structure itself.
Frequently Asked Questions
Which industries still have pensions in 2026?
The sectors with the highest pension access in 2026 are government/public sector (86%), utilities (72%), K–12 and higher education (68%), transportation/warehousing with union coverage (52%), and healthcare at government-affiliated institutions (45%). Private-sector industries with little to no pension access include retail (12%), food service (8%), gig/contract work (0%), and professional services/tech (22%).
What is the median 401(k) balance for someone about to retire?
According to the Federal Reserve’s 2025 Survey of Consumer Finances, the median 401(k) balance for workers aged 55–64 is approximately $87,000. At a 4% safe withdrawal rate, that produces $290 per month. The mean balance is around $312,000, but is heavily skewed by high-income workers.
Can I still get a pension if I work in the private sector?
Yes, but only in specific sectors. Private-sector pension access is highest in unionized manufacturing (auto, aerospace, steel), regulated utilities, some healthcare systems, and legacy corporate plans at companies like IBM. Researching pension availability before accepting a private-sector job offer is one of the most financially significant due diligence steps a worker can take.
What happens to my pension if the company goes bankrupt?
Federal law requires private-sector pensions to be insured by the Pension Benefit Guaranty Corporation (PBGC). If the pension plan fails, the PBGC pays up to $81,519 per year (2026 maximum) for workers who retire at 65. Benefits above that level may be reduced. Public-sector pensions are not covered by PBGC — they are backed by state and local government obligations, which can be restructured in bankruptcy, as Detroit demonstrated in 2013.
Sources and Methodology
Data on pension and 401(k) coverage rates by industry from the Bureau of Labor Statistics National Compensation Survey 2025. Historical private-sector pension coverage data from Economic Policy Institute, “Retirement in America” (2025). 401(k) contribution data by income from Vanguard, “How America Saves 2025”. Median 401(k) balances from the Federal Reserve Survey of Consumer Finances 2025. PBGC maximum guarantee from PBGC 2026 annual data. Public pension underfunding aggregate from Equable Institute State of Pensions 2025. Industry-specific pension coverage rates derived from BLS Employer Benefits Survey supplementary tables.


