The racial wealth gap in America is not a gap — it is a chasm, and it was built by policy, not by accident. The median white household holds $284,310 in net worth; the median Black household holds $44,100 — meaning Black families have roughly 15 cents for every dollar of white family wealth, according to NCRC analysis of Federal Reserve data. That ratio has barely moved in 30 years. The gap was manufactured through decades of deliberate federal policy: the GI Bill that excluded 1.2 million Black veterans, the redlining system that blocked Black homeownership for a generation, and fair lending enforcement that arrived decades too late — long after the compounding was already done.
Key Takeaways
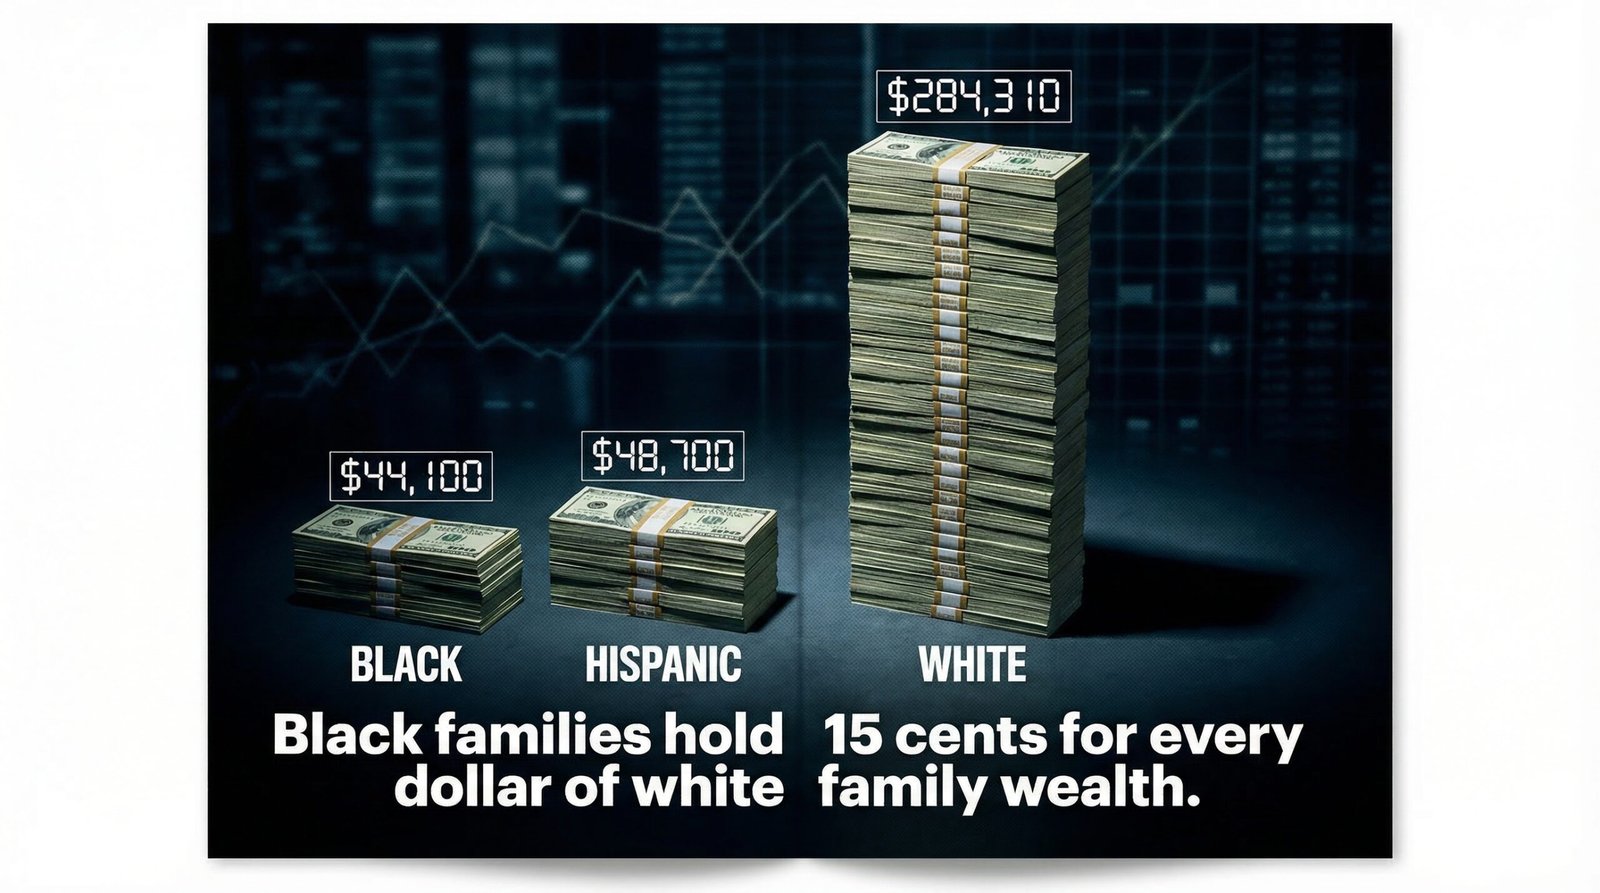
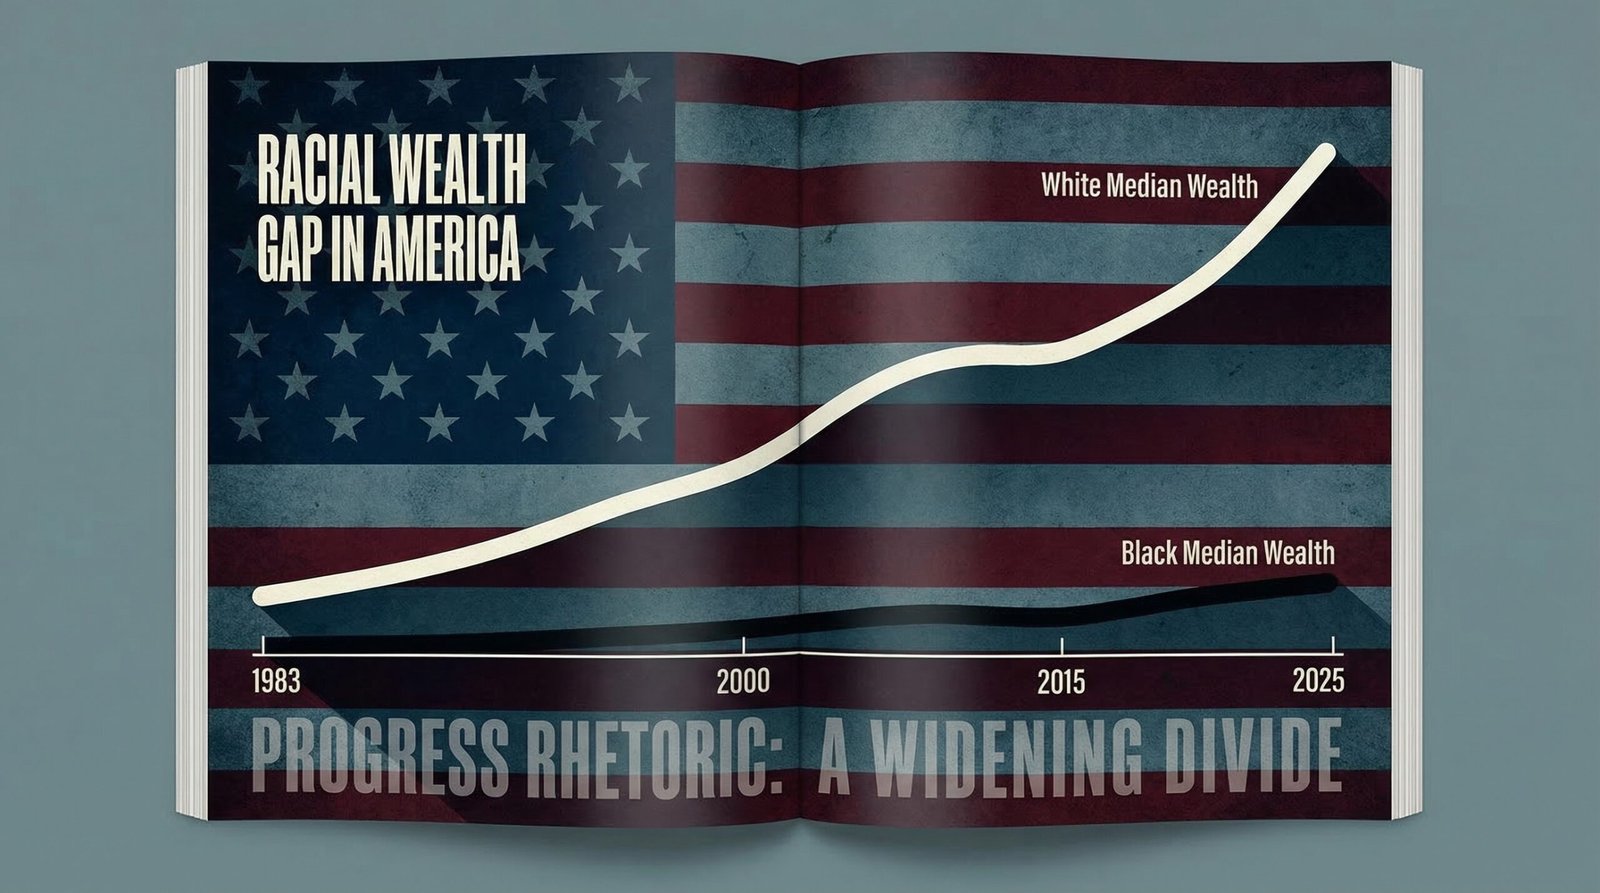
- Median white household wealth: $284,310. Median Black household wealth: $44,100. That’s 15 cents on the dollar — and the ratio has barely changed since 1992.
- Between 2019 and 2022, Black family wealth rose 61% in percentage terms — but the absolute dollar gap between white and Black households widened by approximately $50,000.
- The 1944 GI Bill excluded approximately 1.2 million Black WWII veterans from home loan benefits, college subsidies, and unemployment insurance — benefits that enabled white families to build the postwar middle class.
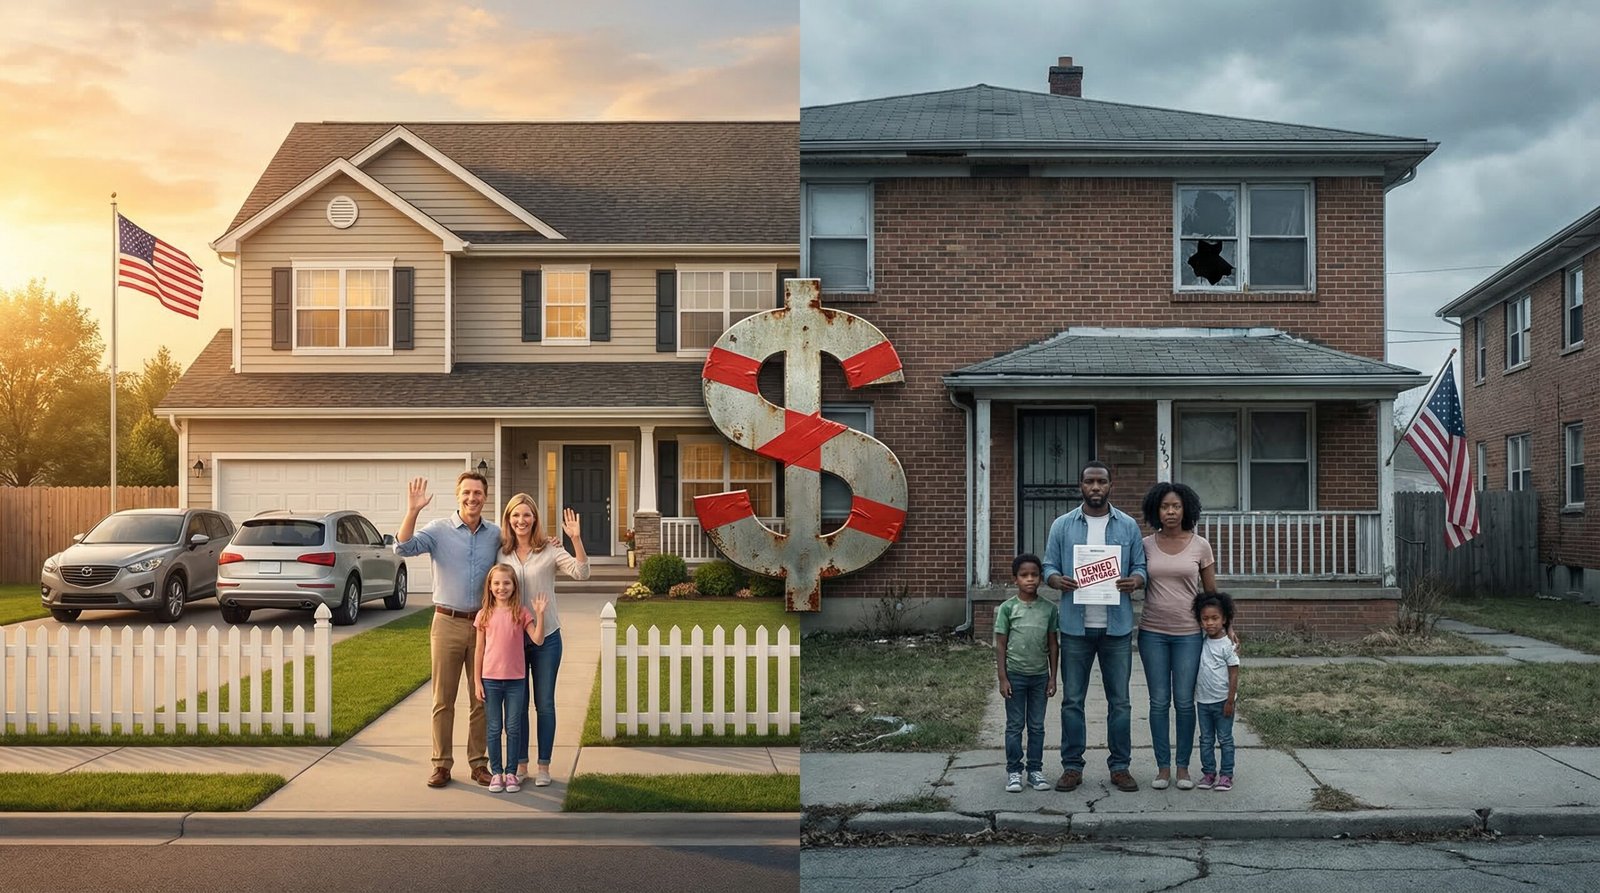
- Federal redlining (1930s–1960s) via the HOLC systematically denied mortgages in Black neighborhoods, blocking the primary American wealth-building vehicle for an entire generation.
- Black homeownership rate in 2024: 43%. White homeownership rate: 73%. The 30-point gap is larger than it was in 1968, when the Fair Housing Act was signed.
- In 2024, 43% of Black adults and 46% of Hispanic adults reported difficulty paying monthly bills, versus 27% of white adults (Federal Reserve SHED report).
- The Census Bureau found that Black households represent 13.6% of all U.S. households but hold only 4.7% of all U.S. wealth.
What Is the Racial Wealth Gap? The Numbers
The racial wealth gap is the difference in accumulated assets — homes, savings, investments, business equity, inheritance — between racial groups in the United States. Unlike income gaps, which measure annual earnings, wealth gaps measure everything a household has built and inherited over time. Wealth is the scoreboard of compounding; it reflects not just what you earned, but what your parents earned, what they could borrow, and what zip code the federal government let them buy into.
The most recent comprehensive data, combining Federal Reserve Survey of Consumer Finances figures with NCRC analysis, shows:
- White households (median net worth): $284,310
- Black households (median net worth): $44,100
- Hispanic households (median net worth): $48,700–$61,600
- Black households hold roughly 15 cents for every dollar of white household wealth
The mean (average) figures are even more extreme, skewed by the ultra-wealthy: white families average over $600,000 in wealth; Black families average $253,000 (in 2019 dollars per NY Fed). That gap widens further as you move up the wealth distribution — the very top is overwhelmingly white, which is the same reason the $84 trillion Great Wealth Transfer will largely bypass Black and Hispanic households entirely.
The Census Bureau’s 2024 wealth data adds another layer of clarity: households with a Black householder make up 13.6% of all U.S. households but hold only 4.7% of all wealth. Put another way: Black America is home to 1 in 7 Americans but owns less than 1 in 20 dollars of national wealth. The generational wealth concentration that already defines this country sits inside a racial concentration that is even more extreme.
None of this is new. The NCRC’s analysis of Survey of Consumer Finances data from 1992 to 2022 shows the median Black-white wealth ratio has remained virtually unchanged for 30 years. Thirty years of diversity initiatives, affirmative action debates, and political speechmaking. The needle has not moved.

How Did the GI Bill Create the Racial Wealth Gap?
The Servicemen’s Readjustment Act of 1944 — the GI Bill — is the most consequential wealth-building legislation in American history. It sent millions of veterans to college on the federal dime, offered low-cost home loans that created the American suburbs, and provided unemployment insurance while veterans transitioned to civilian careers. It is, by most measures, the single largest investment the federal government ever made in the middle class.
Approximately 1.2 million Black veterans were effectively excluded from it.
The bill’s language was race-neutral. The administration was not. Congress, dominated by Southern Democrats in 1944, insisted the bill be administered through local and state agencies — ensuring that in the South, every benefit would be filtered through Jim Crow. The results were systematic:
- Black veterans received dishonorable discharges at higher rates than white veterans, disqualifying them from benefits before they even applied
- Vocational training programs for Black veterans were systematically underfunded — courses were available in theory; equipment and qualified instructors were not
- Banks receiving federal backing for GI Bill home loans simply refused to issue them to Black applicants — with zero federal enforcement consequence
- The new suburbs built with GI Bill home loans included racially restrictive covenants banning Black buyers; the VA and FHA backed those loans anyway
- In Mississippi, one of the most egregious cases documented: of 3,229 VA-guaranteed home loans issued in 1947, exactly two went to Black veterans
While white veterans used GI Bill benefits to buy suburban homes that would appreciate from $10,000 in 1950 to $300,000+ today, Black veterans were steered into urban rentals in neighborhoods the federal government had already designated for disinvestment. The compounding over 80 years — home equity, refinancing, children’s down payment gifts, inheritance — is the racial wealth gap. It didn’t emerge from a disparity in values or work ethic. It was produced by a deliberate federal subsidy that was racially administered.
The same Congress that designed this system also built Social Security with agricultural and domestic worker exclusions that conveniently exempted the majority of Black workers in 1935. The GI Bill was not an anomaly. It was a pattern.
Redlining: How the Federal Government Engineered the Racial Wealth Gap Into Every American Zip Code
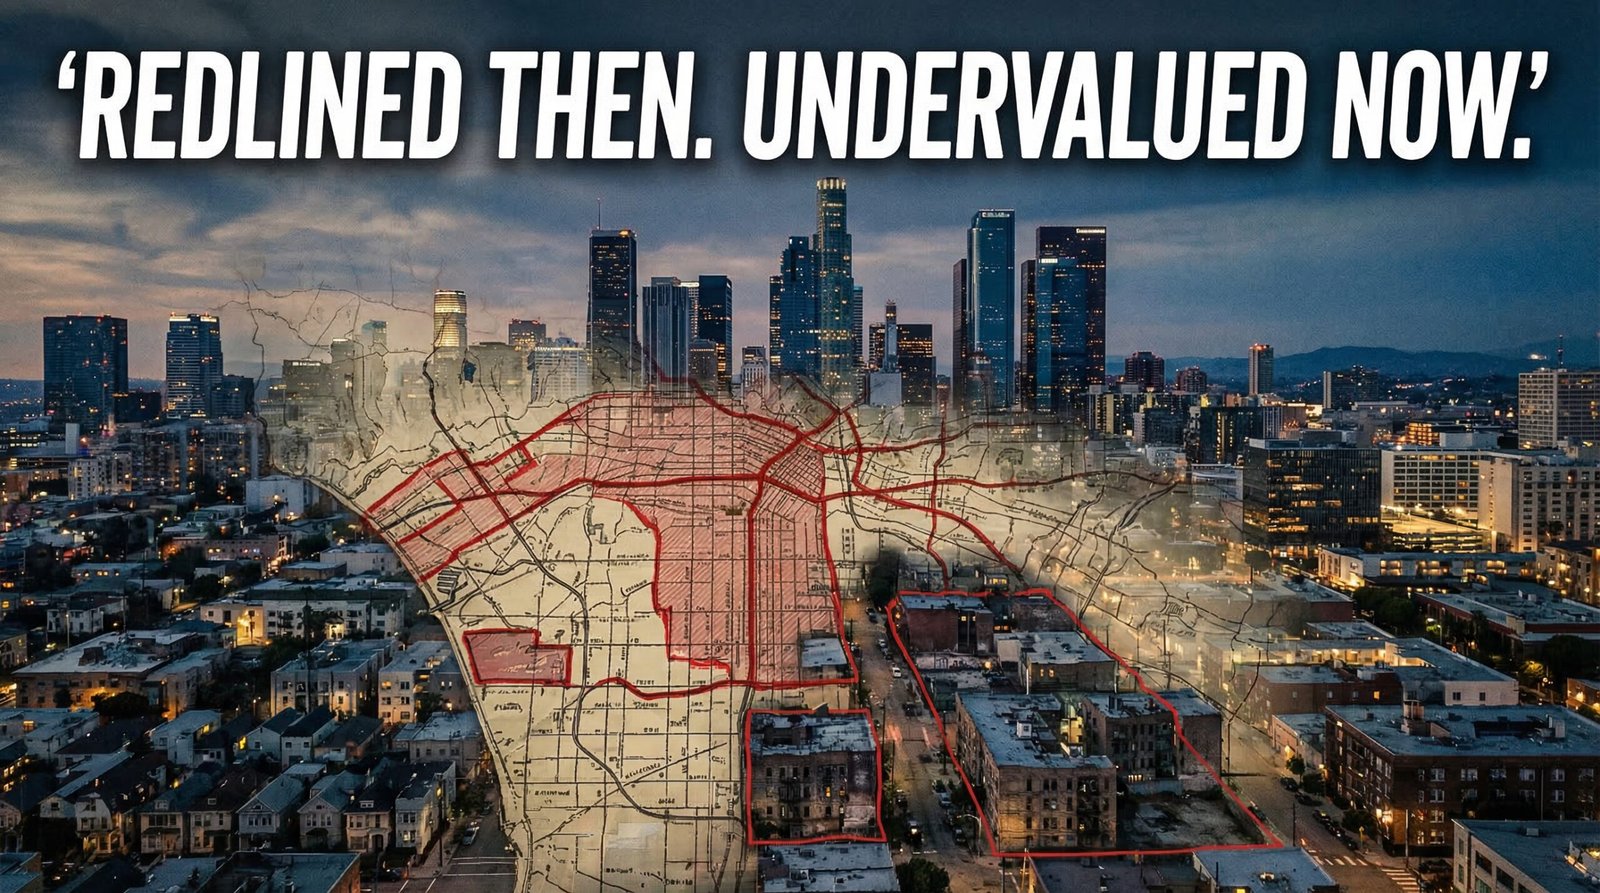
Redlining was not a real estate industry quirk. It was a federal program. Starting in the 1930s, the Home Owners’ Loan Corporation (HOLC) — a New Deal agency — created color-coded maps of American cities grading neighborhoods for mortgage investment risk. Neighborhoods with significant Black populations were systematically marked “Hazardous” in red. Those maps determined where banks would and would not issue federally backed mortgages for the next three decades.
Housing historian Richard Rothstein, in The Color of Law, documents how HOLC appraisers explicitly used race as a negative factor in ratings — not as a proxy for economics, but as a direct input. A neighborhood’s racial composition lowered its rating regardless of housing quality, income levels, or employment stability. This wasn’t private discrimination that the government failed to stop. It was government-created discrimination that private actors then followed.
The Federal Housing Administration (FHA), created in 1934, amplified redlining nationally. The FHA’s Underwriting Manual explicitly warned against “infiltration of inharmonious racial groups” as a factor that reduced property values — and refused to insure mortgages in integrated neighborhoods. From 1934 to 1962, the FHA insured $120 billion in home loans. Less than 2% went to non-white borrowers.
The practical effect: while white families in FHA-backed suburbs were building equity through the greatest real estate appreciation in American history (1945–1975), Black families in redlined neighborhoods were locked out of that appreciation cycle entirely. The University of Wisconsin’s IRP notes that HOLC appraisals laid “the foundation for the racial wealth gap” — and research consistently shows that formerly redlined zip codes remain economically disadvantaged today, 60 years after the practice was formally ended.
The Fair Housing Act passed in 1968. It banned future discrimination. It did not undo 30 years of equity that white families had already built — and that Black families had been systematically prevented from building. The compounding clock had been running for a generation before the law changed. By the time it did, the wealth gap was already structural.
Is the Racial Wealth Gap Closing — or Getting Worse?
In his 2024 State of the Union address, President Biden claimed the racial wealth gap was “the smallest it has been in 20 years.” Duke University researchers responded with a working paper titled: “U.S. Racial Wealth Gap Is Persistent and Growing.” Both can be technically true at the same time — and the distinction matters enormously.
Here’s the paradox: Between 2019 and 2022, median Black family wealth rose 61% and Hispanic family wealth rose 47%, compared to 31% for white families. By percentage growth, minority families were gaining faster. By absolute dollars, the white-Black wealth gap widened by approximately $50,000 in the same period, reaching over $220,000.
The math is simple: if you have $10 and I have $100, and we both grow by 50%, you now have $15 and I have $150. Your percentage gain is identical to mine. The gap between us just doubled in absolute terms. This is the “percentage growth vs. absolute gap” illusion that politicians exploit when discussing the racial wealth gap. The ratio improved slightly. The chasm in raw dollars got larger.
The Chicago Fed’s 2024 working paper puts it bluntly: “The racial wealth gap continues to worsen, despite increased educational attainment, business formation, and homeownership.” Higher education, entrepreneurship, and homeownership have all increased among Black Americans — and the wealth gap has still widened. That finding is significant because it directly refutes the “just work harder and educate yourself” prescription. When the structural mechanisms that create the gap remain intact, individual achievement adjusts the data at the margins while the underlying chasm persists.
The 2024 Federal Reserve SHED report shows the financial well-being fallout in real time: 82% of Asian adults were doing okay financially, 76% of white adults, 67% of Hispanic adults, and 64% of Black adults. Forty-three percent of Black adults and 46% of Hispanic adults reported difficulty covering monthly bills — versus 27% of white adults. The gap is not historical data. It is people’s bank accounts right now.

Why Homeownership Alone Won’t Close the Racial Wealth Gap
American policymakers default to homeownership as the solution to the racial wealth gap. The logic sounds reasonable: homeownership is the primary wealth-building mechanism for the middle class, Black homeownership rates are low, therefore increase Black homeownership. Problem solved. Except it isn’t solving it — and there are structural reasons why.
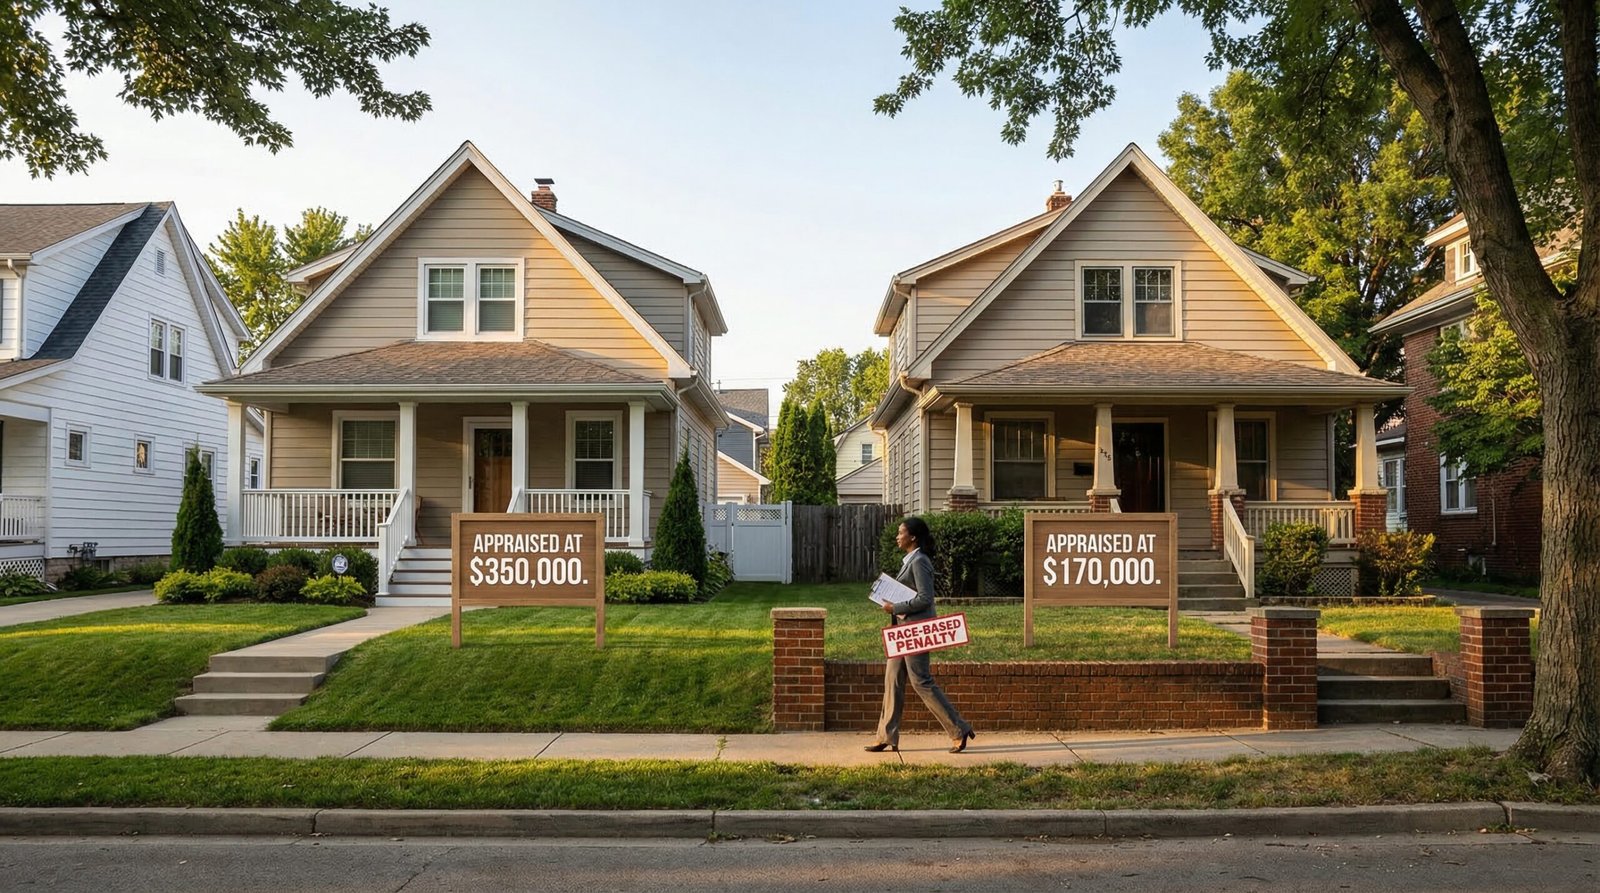
The appraisal gap. Research from Freddie Mac and Brookings documents a persistent racial appraisal bias: identical homes in Black neighborhoods are appraised at lower values than identical homes in white neighborhoods. A 2021 Freddie Mac analysis found that appraisals of homes in Black and Latino neighborhoods were more likely to come in below the contract price — at 12.5% and 15.4% of appraisals respectively, versus 7.4% in predominantly white areas. Lower appraisals mean smaller loans, smaller equity, and smaller inheritance. Even when Black families buy homes, the homes are systematically valued less. The investment doesn’t compound the same way.
The location problem. Exclusionary zoning has historically confined Black buyers to neighborhoods with lower appreciation trajectories. A home in a formerly redlined neighborhood that was “allowed” to be sold to a Black family in 1975 has not appreciated at the same rate as an equivalent home in a suburb built for white GI Bill recipients. The 50-year appreciation difference compounds into a multi-generational wealth gap regardless of individual homeownership rates.
The “Bank of Mom and Dad” gap. For Millennial first-time buyers, parental wealth transfers — down payment gifts, co-signing — have become the dominant mechanism for homeownership access. Among white Millennials, parental wealth is frequently available. Among Black Millennials whose parents were redlined out of wealth-building for a generation, it is not. The racial homeownership gap between Millennials is larger than it was between their parents — because the structural exclusion of the GI Bill era has now compounded into a “no parental down payment” reality.
The Black homeownership rate in 2024 stands at 43%, compared to 73% for white Americans. The 30-point gap is larger than it was in 1968 when the Fair Housing Act passed. That is not a rounding error. That is 56 years of a law that banned discrimination without fixing the compounded disadvantage that discrimination had already created.
The Counter-Argument: Personal Choices and Education Drive Wealth Differences
The mainstream conservative counter-argument holds that the racial wealth gap primarily reflects differences in education levels, marriage rates, savings behavior, and career choices — not historical policy — and that individual agency, not government intervention, is the path to closing it.
The data partially supports the education component: households with college degrees hold substantially more wealth across all racial groups. Marriage rates correlate with household wealth formation. Savings rates vary across demographic groups.
Where the counter-argument breaks down:
The Chicago Fed’s 2024 research is unambiguous: educational attainment has risen among Black Americans over the past three decades — and the wealth gap has widened anyway. If education were the primary driver, closing the education gap would close the wealth gap. It hasn’t. A 2023 St. Louis Fed analysis found that college-educated Black families still hold significantly less wealth than non-college-educated white families. The credential doesn’t unlock the same wealth as it does for white graduates — because the credential doesn’t come with parental wealth transfers, low-cost home loans from family equity, or inheritance.
On savings behavior: Black households hold approximately $2,200 in checking and savings accounts versus $10,000 for white households. The behavioral explanation says this reflects different savings habits. The structural explanation notes that if your parents’ home was redlined and never appreciated, if your GI Bill benefits were denied, if your net worth starts at $44,000 versus $284,000 — the reason you save less is that you have less to save from. Behavior and structure are not alternatives. The structure produces the behavior.
On marriage rates: the decline in marriage rates among Black Americans is a real phenomenon with real wealth implications. It is also not independent of economics. Research from Princeton’s Fragile Families project and others consistently finds that the primary driver of non-marriage among low-income Black Americans is economic instability — not cultural preference. Men without stable employment are less likely to marry. PNTR trade policy that eliminated 3 million manufacturing jobs disproportionately affected Black men in industrial cities. The marriage rate decline followed the manufacturing decline. Structure again.
The honest summary: individual choices matter at the margin. They do not explain a gap that has remained constant for 30 years while educational attainment, homeownership, and business formation have all increased. The residual — the gap that persists after controlling for behavior — is the structural legacy of policy decisions made before most living Americans were born.
FAQ: Racial Wealth Gap
What is the racial wealth gap in America in 2025?
The most recent comprehensive data (Federal Reserve Survey of Consumer Finances, NCRC analysis) shows median white household wealth at approximately $284,310 versus $44,100 for Black households — a ratio of about 15 cents per dollar. Hispanic households hold approximately $48,700–$61,600. Black households represent 13.6% of U.S. households but hold only 4.7% of total national wealth (Census Bureau, 2024).
How did redlining cause the racial wealth gap?
Federal redlining, implemented through the Home Owners’ Loan Corporation (HOLC) starting in the 1930s and amplified by FHA underwriting policies through the 1960s, systematically denied mortgages in Black neighborhoods. From 1934 to 1962, the FHA insured $120 billion in home loans, less than 2% of which went to non-white borrowers. This blocked Black families from homeownership — the primary American wealth-building mechanism — during the period of greatest suburban appreciation. The compounded equity loss over 60–80 years is the single largest measurable cause of today’s racial wealth gap.
Did the GI Bill exclude Black veterans?
Yes. While the GI Bill’s text was race-neutral, it was administered through state and local agencies under Jim Crow. Approximately 1.2 million Black WWII veterans were effectively excluded from home loan benefits (banks refused applications with no federal enforcement), college funding (segregated institutions lacked capacity), and vocational training (programs were underfunded for Black enrollees). In Mississippi in 1947, of 3,229 VA-guaranteed home loans, only two went to Black veterans. The GI Bill built the white middle class; it largely bypassed the Black middle class.
Is the racial wealth gap closing?
By percentage, Black and Hispanic family wealth grew faster than white family wealth between 2019 and 2022 (61% and 47% vs. 31%). But in absolute dollar terms, the white-Black wealth gap widened by approximately $50,000 during the same period, reaching over $220,000. The Chicago Fed’s 2024 working paper concluded that “the racial wealth gap continues to worsen, despite increased educational attainment, business formation, and homeownership.” The percentage ratio shows marginal improvement; the dollar gap is growing.
Sources & Methodology
Primary sources: NCRC Racial Wealth Snapshot Series — Black American Economic Outlook (median wealth by race, 2024 data); Federal Reserve FEDS Notes: Changes in Racial Inequality in the Survey of Consumer Finances (October 2023); NY Fed Liberty Street Economics: Racial and Ethnic Inequalities in Household Wealth Persist (June 2024); U.S. Census Bureau: Wealth by Race of Householder (April 2024); Federal Reserve SHED Report 2024 (May 2025); Duke University: U.S. Racial Wealth Gap Is Persistent and Growing (June 2024); Chicago Fed Working Paper: Racial Wealth Gains and Gaps (2024); History.com: How the GI Bill’s Promise Was Denied to a Million Black WWII Veterans; NCRC: The Racial Wealth Gap 1992 to 2022; Richard Rothstein, The Color of Law (2017) — federal redlining historical documentation; Economic Policy Institute: Financial Disparities and the 2025 Slowdown.