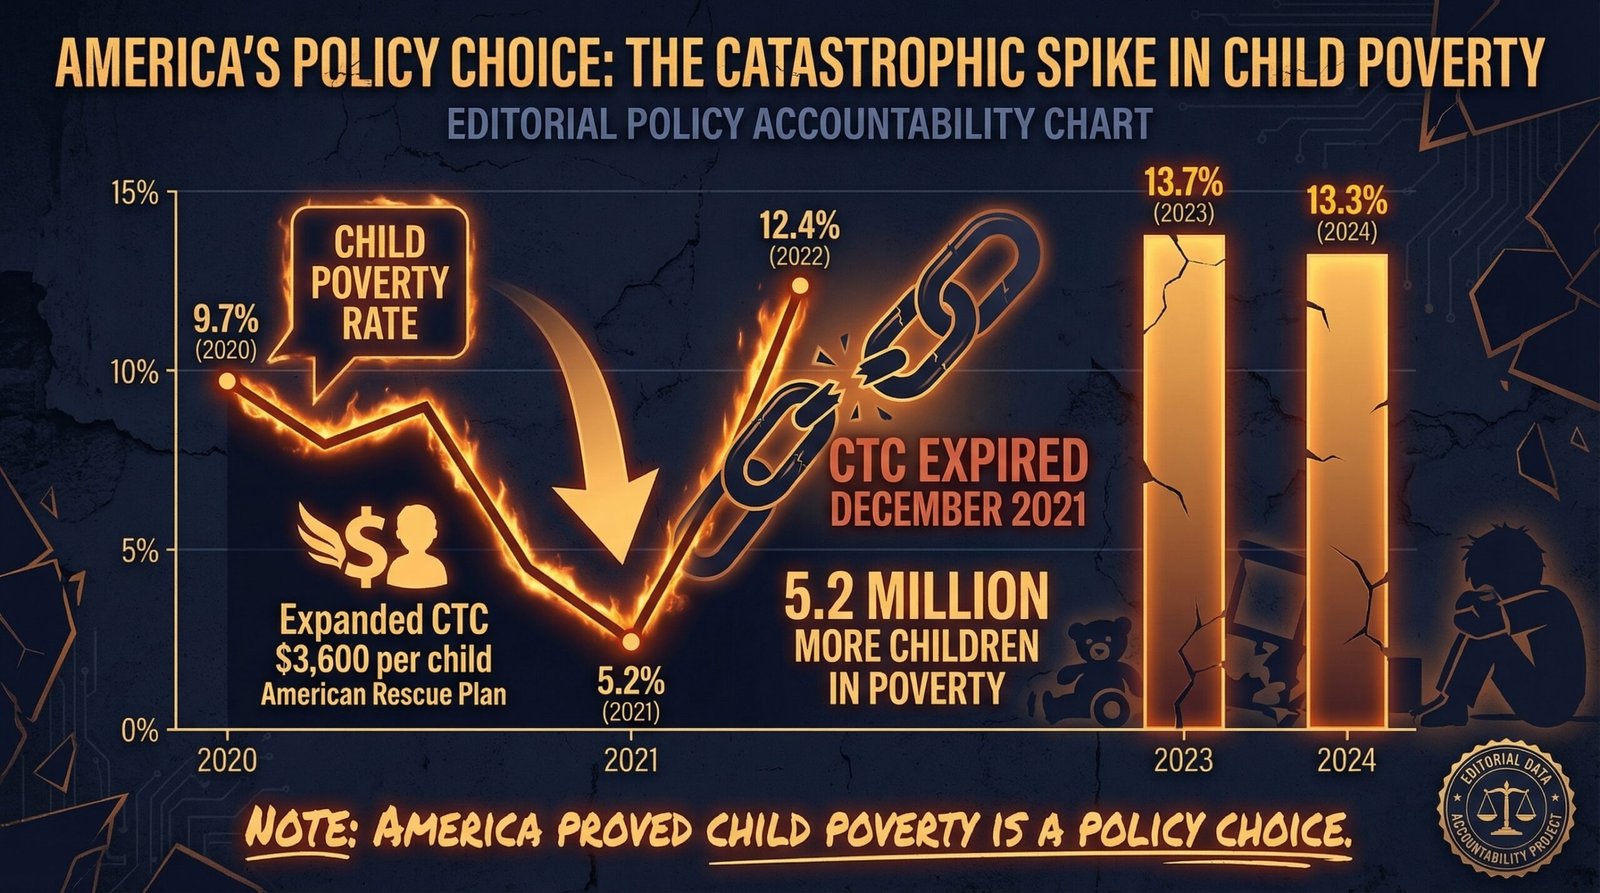
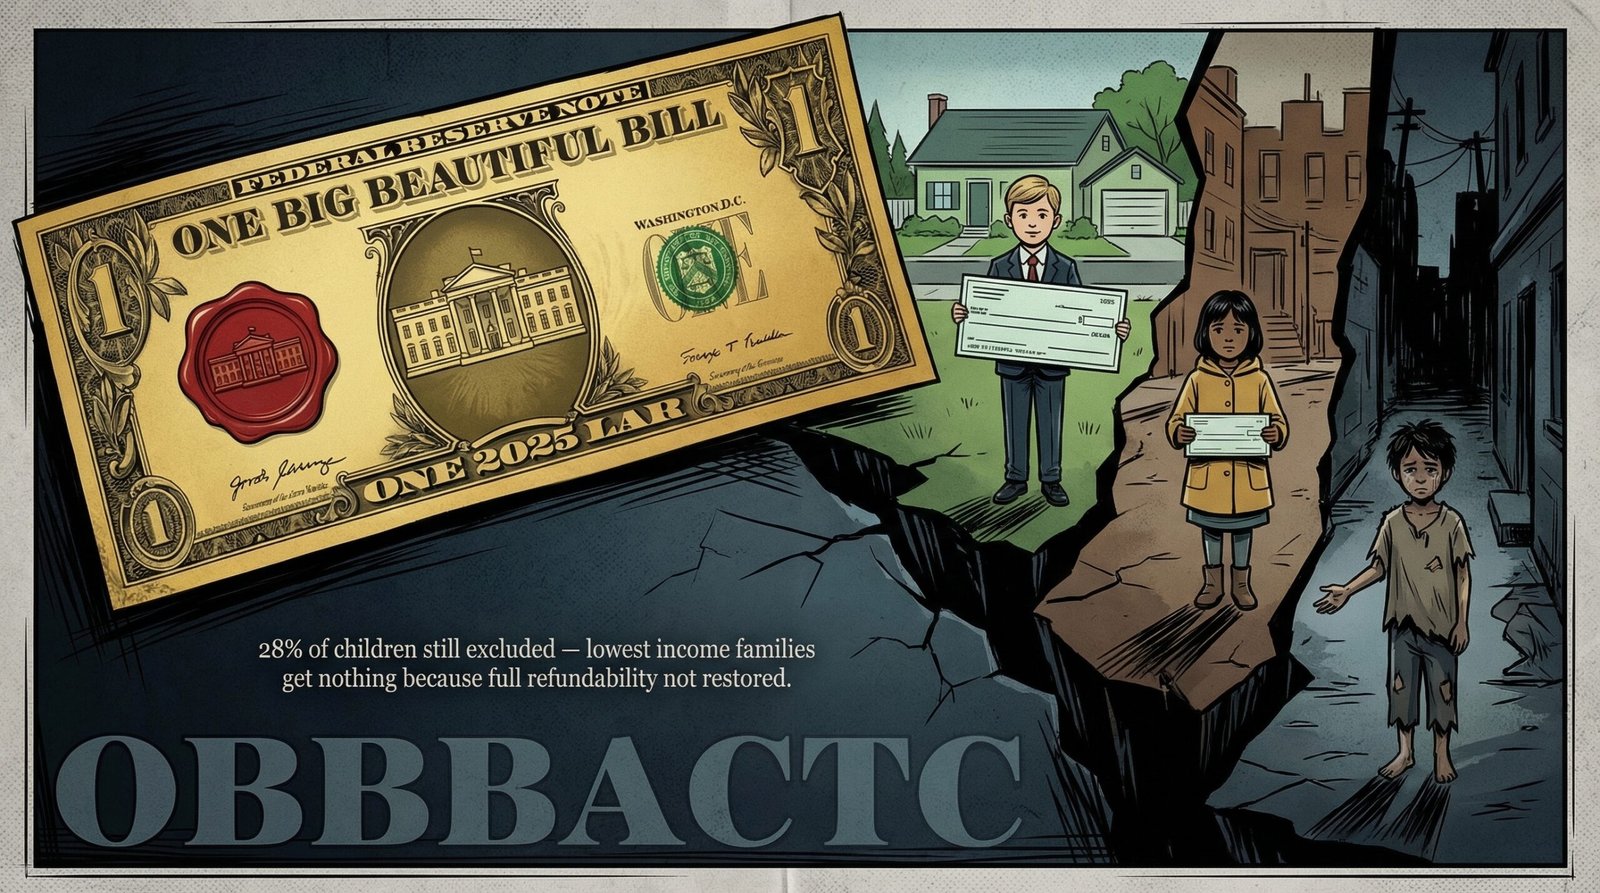
American child poverty is not an intractable social problem — it is a policy choice. In 2021, the United States proved this with mathematical precision: by expanding the Child Tax Credit to $3,600 per child and delivering it as monthly payments to virtually all families, the country reduced child poverty from 9.7% to a historic low of 5.2% in a single year, lifting approximately 2.9 million children out of poverty. Congress then allowed the expansion to expire, and by 2022 child poverty had more than doubled to 12.4% — the largest one-year increase on record. As of 2025, approximately 13 million American children remain in poverty, and the One Big Beautiful Bill Act’s modest CTC increase still excludes the 28% of children in the lowest-income families. The experiment worked. The policymakers chose not to continue it.

Key Takeaways:
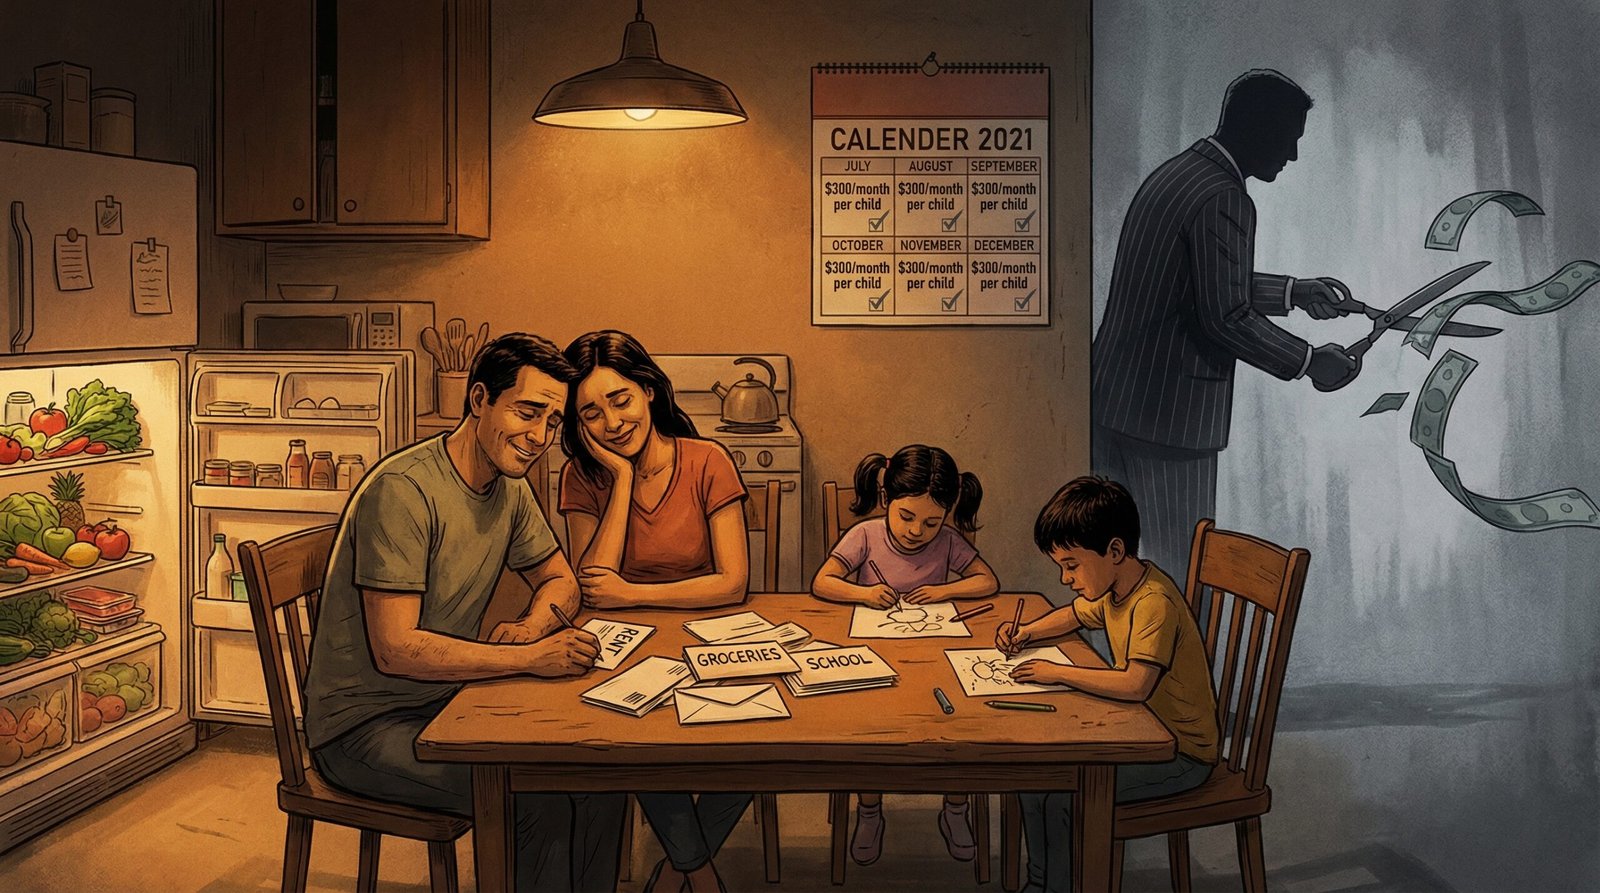
- In 2021, the American Rescue Plan expanded the Child Tax Credit to $3,600 per child under 6 and $3,000 per child ages 6–17, made it fully refundable, and delivered it as monthly advance payments of up to $300/month from July through December 2021.
- Child poverty fell from 9.7% in 2020 to a historic low of 5.2% in 2021, lifting approximately 2.9 million children out of poverty.
- When the expansion expired December 31, 2021, child poverty more than doubled to 12.4% in 2022 — the largest single-year increase in child poverty ever recorded, representing 5.2 million more children in poverty.
- By 2023, child poverty rose to 13.7%. In 2024, approximately 9.7–11 million American children were living in poverty.
- Food insufficiency among families with children dropped by 25% during the monthly CTC payment period, then spiked sharply in January 2022 after payments stopped.
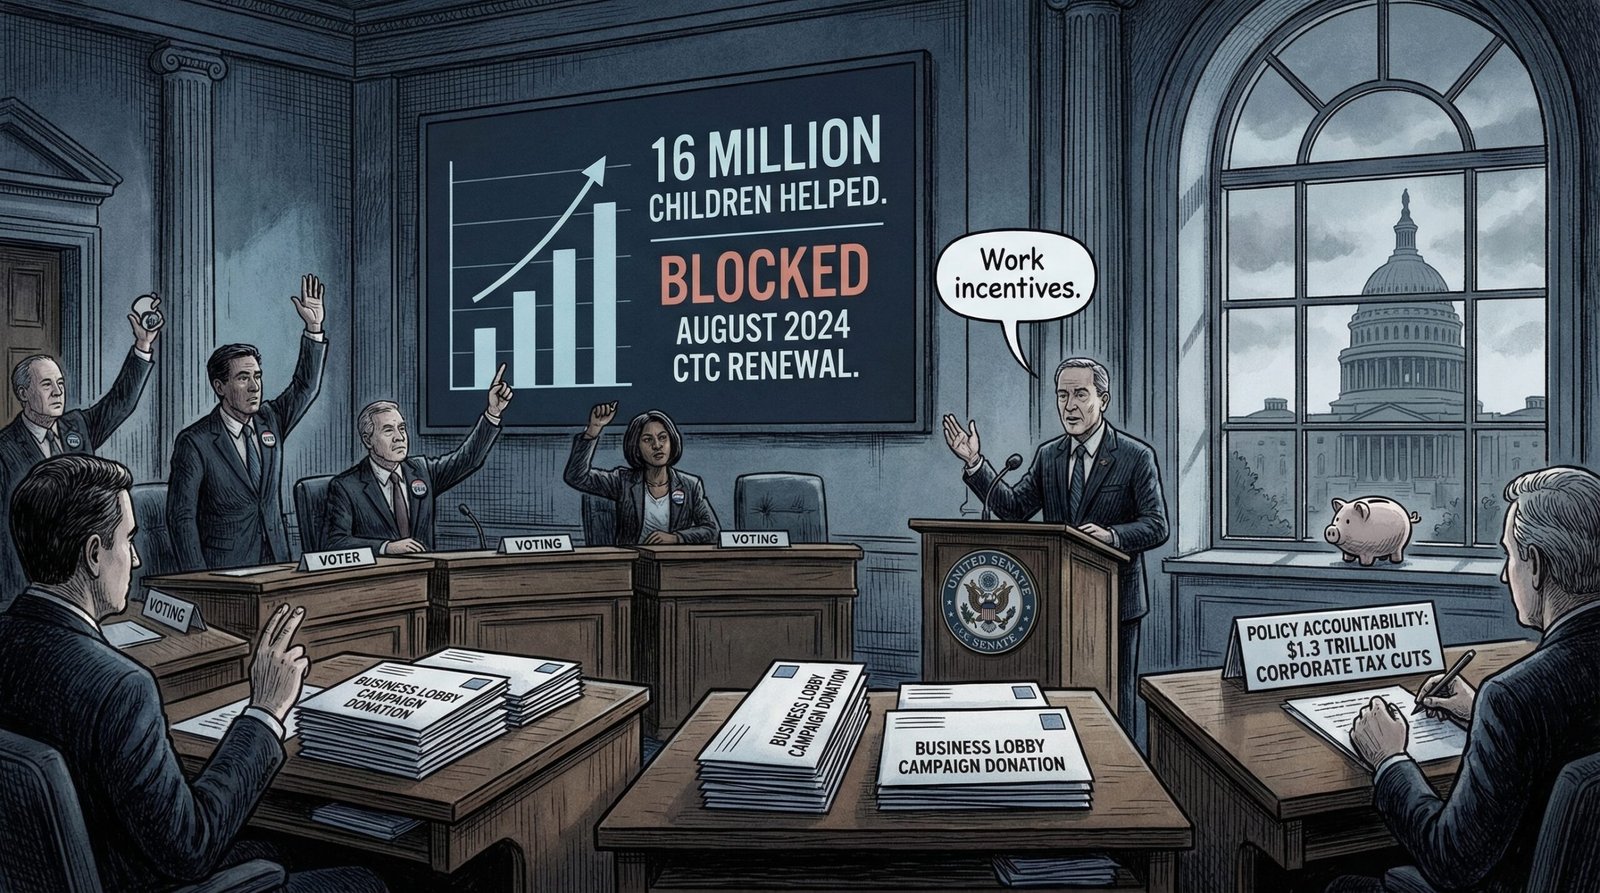
- In August 2024, Senate Republicans blocked the bipartisan Tax Relief for American Families and Workers Act, which passed the House 357–70 and would have helped an estimated 16 million children. Annual cost: $33 billion.
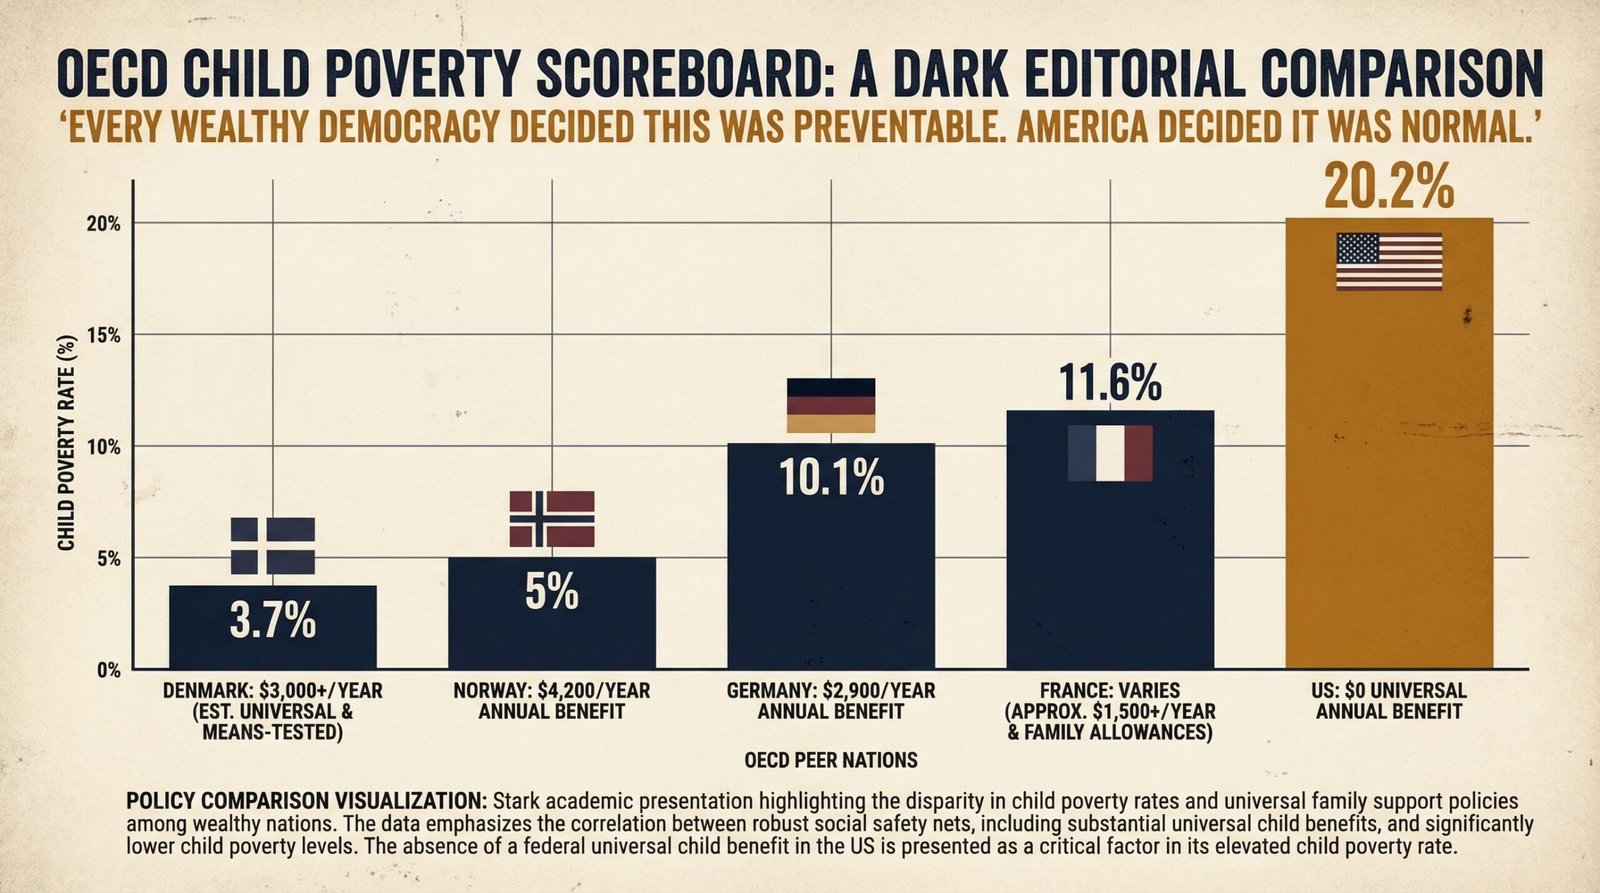
- The United States has a child poverty rate of 20.2% — the worst among G7 nations. Denmark: 3.7%. Norway: 5%. Germany: 10.1%.
- McLaughlin and Rank (Washington University) calculated the annual cost of US child poverty at $1.0298 trillion — 5.4% of GDP. For every $1 spent to reduce child poverty, the government saves at least $7 in future costs.
- Black children: 20.7% poverty rate. Hispanic children: 22%. White children: 11.2%. Asian children: 9.9% (2023 SPM data).
- The OBBBA (July 4, 2025) increased the CTC to $2,200 per child but did not restore full refundability. Columbia estimates 28% of children under 17 remain ineligible for the full credit — the children who need it most.
What Happened: How the United States Cut Child Poverty in Half, Then Put Every Child Back
Child poverty in America has a long, relatively stable history of being somewhere between bad and terrible. The Supplemental Poverty Measure (SPM), which accounts for government assistance programs, taxes, and actual household expenses, has tracked child poverty since 2009. Through the 2010s and into 2020, child poverty fluctuated between roughly 12% and 18% depending on the year and measurement method used. Then something extraordinary happened in 2021 that nobody in Washington seemed to want to learn from.
The American Rescue Plan Act (ARPA), signed by President Biden in March 2021, temporarily expanded the Child Tax Credit in three significant ways. First, it raised the credit from $2,000 per child to $3,600 for children under 6 and $3,000 for children ages 6–17. Second, it made the credit fully refundable — meaning that families with little or no income could receive the full benefit, rather than being limited to what their tax liability allowed. Third, it authorized the IRS to deliver the credit as monthly advance payments of $300 per child under 6 and $250 per child 6–17, from July through December 2021, rather than as a lump sum at tax filing time.
The results were immediate and measurable. The Columbia Center on Poverty and Social Policy tracked monthly child poverty throughout 2021 and found the rate declining month by month as the payments arrived. By the end of 2021, the SPM child poverty rate had fallen to 5.2% — the lowest ever recorded, a 46% decline from the 9.7% rate in 2020. Approximately 2.9 million children were lifted out of poverty, with the CTC expansion alone responsible for lifting 2.1 million of them. Food insufficiency among households with children dropped by 25% during the payment period. The data on timing was unambiguous: the payments arrived, poverty fell; the payments stopped, poverty spiked.
Then December 31, 2021 arrived. The expanded CTC was authorized as a one-year provision in ARPA, with the assumption embedded in the legislation that Congress would extend it. Congress did not. The last monthly payment went out in December 2021. By January 2022, Columbia’s monthly tracker showed child poverty spiking back. The full-year 2022 Census data confirmed the scale of the reversal: child poverty had more than doubled from 5.2% to 12.4% — 5.2 million more children in poverty in a single year. The CBPP called it “the largest one-year increase on record.” The experiment worked. Congress chose to end it. Related: SNAP cuts 2026, why childcare costs are destroying family finances, and why 67% of Americans live paycheck to paycheck.
How the Expanded CTC Actually Worked — and Who It Helped That the Old Version Ignored
Understanding why the expansion worked requires understanding why the pre-2021 Child Tax Credit was structurally designed to exclude the families most in need of it. The original CTC, created in 1997 and gradually expanded over subsequent decades, was a tax liability reduction tool — it offset what you owed in federal income taxes. Families with low or no income tax liability received little or nothing. When the credit was made partially refundable in 2001, families still needed to earn at least $2,500 to qualify for even a partial benefit. The result: the families with the least income — single-parent households, informal workers, seasonal workers, and the very poorest families — received zero from a program whose stated purpose was to help families with children.
The 2021 expansion inverted this logic. By making the credit fully refundable — so that a family with $0 income received the same per-child payment as a family earning $50,000 — it functioned more like the universal child benefit programs that exist in most wealthy democracies and less like a tax preference for families who already had enough income to generate tax liability. The monthly payment structure addressed a second design flaw: the original credit’s annual lump-sum delivery meant families had to wait until the following spring to access funds needed for rent, food, and childcare in July. Monthly payments matched benefit delivery to when the expenses actually occurred.
The demographic impact reflected the structural change. Black and Latino children, children in single-parent households, rural children, and children in large families — groups historically poorly served by the means-tested structure of the old credit — experienced disproportionate poverty reductions under the expansion. Columbia’s researchers found that these groups’ poverty rates fell more sharply in 2021 precisely because the full refundability provision reached them for the first time. Related: the racial wealth gap and Millennial retirement savings crisis.
Who Blocked the Renewal: The Political History of Letting Child Poverty Double
The story of how the expanded Child Tax Credit died is a case study in how American policy works when concentrated interests clash with diffuse benefits. The expanded CTC had massive public support — polling consistently showed 70%+ approval across party lines. The economic evidence for its effectiveness was unusually clean. And yet the policy ended, and multiple attempts to revive it were systematically blocked over the following three years.
The first attempt at extension came through the Build Back Better framework in late 2021. Senator Joe Manchin (D-WV) was the pivotal vote. Manchin’s objections focused on work requirements — he wanted the expanded benefit conditioned on parental employment rather than provided universally. Negotiations failed, and the framework collapsed in December 2021, just as the last monthly CTC payment was going out. The work requirement debate was substantive — it reflected a genuine philosophical divide about whether the credit should function as a wage supplement for working parents or as a universal child benefit. But the practical outcome was that 5.2 million children fell back into poverty in 2022 while the philosophical debate continued.
The second major attempt came in early 2024 with the Tax Relief for American Families and Workers Act, negotiated by Senate Finance Chairman Ron Wyden (D-OR) and House Ways and Means Chairman Jason Smith (R-MO). The House passed it 357–70 on January 31, 2024, with 169 Republicans in favor. The bill would have helped an estimated 16 million children and lifted approximately 500,000 out of poverty. Annual cost: $33 billion. On August 1, 2024, Senate Republicans blocked it, falling short of 60 votes. Work incentive concerns and cost-offset disputes were cited. The same Senate had extended trillions in business tax provisions. As we’ve detailed in our analysis of the revolving door lobbying machine and how lobbying shapes policy outcomes, the children who would have benefited were not a significant campaign finance constituency.
In 2024, the Senate blocked a bipartisan bill to help 16 million poor children at an annual cost of $33 billion. In the same session, it extended $1.3 trillion in business tax preferences. No senator was asked to explain the difference.
The OECD Comparison: How the US Child Poverty Rate Became the Worst in the Wealthy World
The United States’ child poverty problem is not an inevitable consequence of its income distribution or economic structure. It is a direct consequence of policy choices about how to structure family support programs — choices that are clearly visible when compared against peer nations. Under the standard relative poverty measure, the United States has a child poverty rate of approximately 20.2% — the worst among G7 economies and dramatically higher than comparable wealthy nations.
The countries with the lowest child poverty rates share a structural feature: they provide universal child benefits — unconditional cash payments to all families with children, regardless of employment status, income level, or tax liability. Denmark, with a child poverty rate of approximately 3.7%, provides a universal child benefit equivalent to roughly $2,600 per year per young child, paid quarterly to all families with no income test. Norway, at approximately 5%, provides a monthly universal child benefit (barnetrygd) of roughly $4,200 annually per child under 18. Germany, at approximately 10.1%, provides Kindergeld — a monthly universal child benefit currently €255/month per child — to all resident families regardless of income.
The United States provides a Child Tax Credit that requires earned income to access fully, phases out at higher income levels, and has never been designed as a universal benefit. This means that the families with the lowest incomes — typically the ones with the highest poverty risk — receive the least support or none at all. Academic research comparing child poverty across countries consistently finds that this structural choice — means-tested vs. universal — is the primary driver of cross-national differences in child poverty outcomes, not GDP per capita, not overall spending levels, and not labor market conditions. Related: US healthcare costs vs OECD peers.
The $1.03 Trillion Question: What Does Child Poverty Actually Cost the Economy?
The political debate around child poverty support programs consistently frames the cost question as “how much does it cost to help poor children?” This is the wrong question. The more analytically complete question is “what does it cost the economy when we don’t help poor children?” — and the answer is substantially larger than the cost of the intervention.
A landmark study by Mark Robert Rank and Michael McLaughlin at Washington University in St. Louis calculated the annual aggregate cost of child poverty in the United States at $1.0298 trillion — approximately 5.4% of GDP. The cost calculation aggregates four categories: lost productivity and earnings in adulthood (childhood poverty is associated with lower educational attainment, reduced labor market participation, and lower lifetime wages); increased costs of crime and incarceration; increased healthcare utilization (childhood poverty is a leading social determinant of adult health outcomes); and increased public expenditures on SNAP, Medicaid, housing assistance, and social services among adults who experienced childhood poverty.
The Peterson Foundation summarized the research finding: for every $1 invested in reducing childhood poverty, the government ultimately saves at least $7 in future economic costs. The expanded CTC cost approximately $120 billion per year to operate at full scale. If the $7-to-$1 return ratio holds even approximately, the long-run fiscal return from the expanded CTC is substantially positive — the country was saving money by spending it.
The demographic concentration amplifies the economic cost further. Black children face a 20.7% poverty rate; Hispanic children 22%; American Indian and Alaska Native children 19.7% — populations already disproportionately excluded from wealth-building systems documented across this site, from the racial wealth gap to institutional homeownership barriers. Child poverty in these communities is the current-generation output of systems designed decades earlier to produce exactly these outcomes.
The One Big Beautiful Bill: Did the 2025 CTC Increase Actually Fix Anything?
When the One Big Beautiful Bill Act was signed into law on July 4, 2025, it included a permanent increase in the Child Tax Credit from $2,000 to $2,200 per child — the first nominal increase in the credit since the 2017 Tax Cuts and Jobs Act raised it from $1,000 to $2,000. For families in the middle and upper-middle income range who already claimed the full credit, the $200 increase provides modest relief. For families living in poverty, it changes very little.
The structural problem — the refundability limitation — was not addressed. Families must earn at least $2,500 to begin receiving any refundable portion, and the refundable amount is limited to 15% of earnings above that threshold. Columbia University’s Center on Poverty and Social Policy estimated that in 2025, more than 1 in 4 children (28%) under age 17 are ineligible for the full Child Tax Credit under OBBBA because their families’ incomes are too low. As ITEP noted, “the 2025 Trump tax law slightly increased the Child Tax Credit in a way that benefits virtually none of the children who most need help.”
The OBBBA simultaneously cut $863 billion from Medicaid and $295 billion from SNAP over the budget window — programs serving many of the same families with children excluded from the full CTC. As detailed in our analysis of the SNAP cuts and the Big Beautiful Bill reconciliation framework, 7.5–10 million people are projected to lose Medicaid coverage and 3.2 million adults are projected to lose SNAP. The $200 CTC increase does not offset the lost food assistance. The net effect on the lowest-income families with children is materially negative.
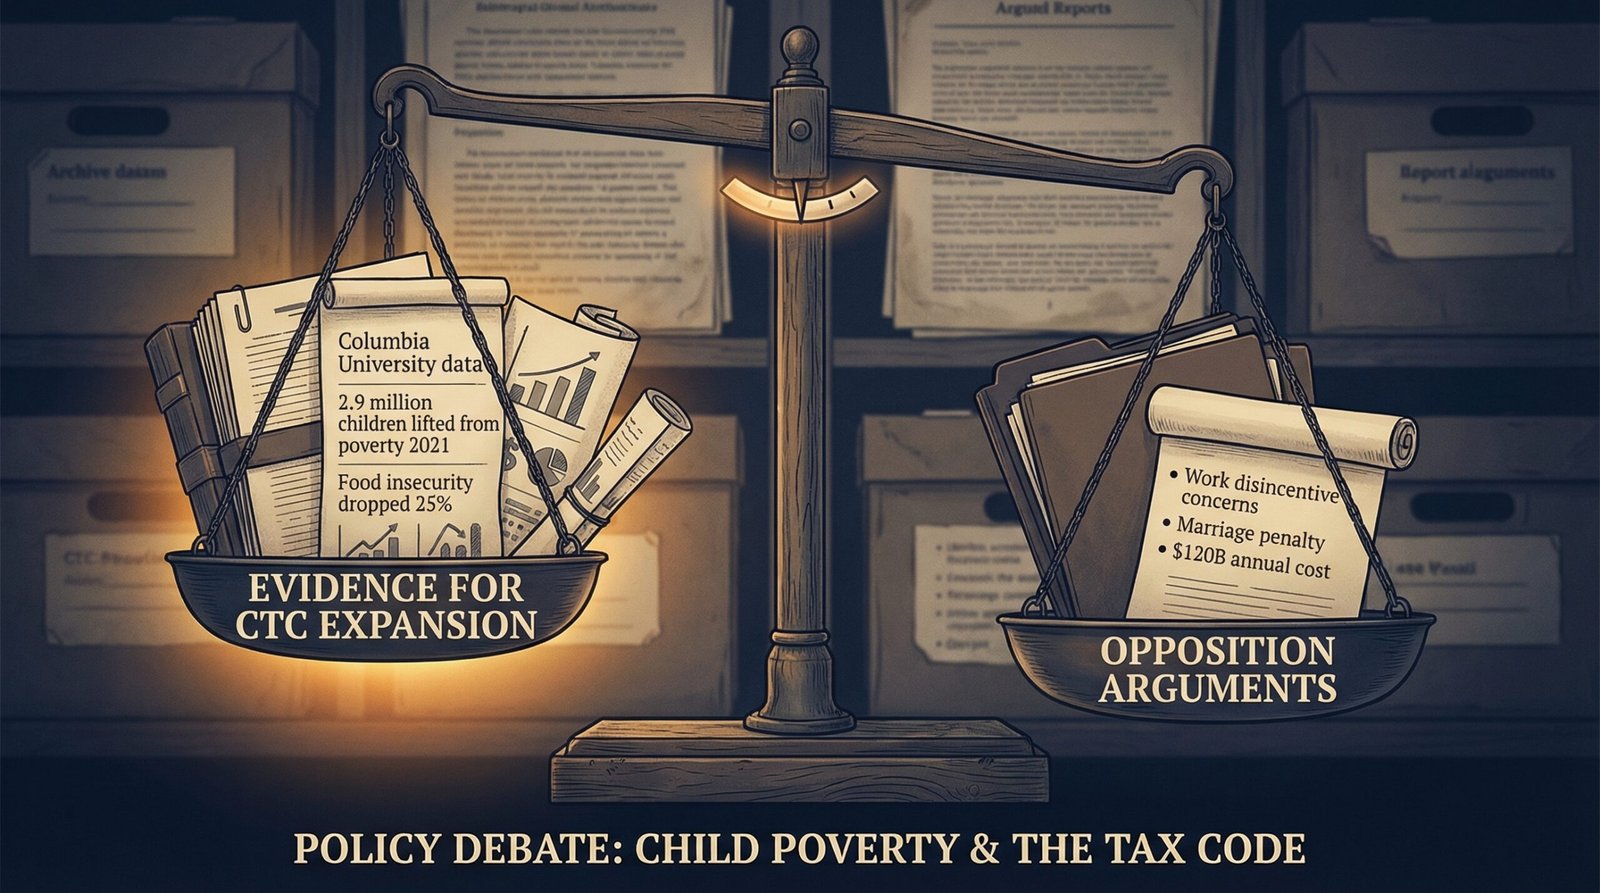
The Counter-Argument: Work Incentives, Marriage Penalties, and Why Not Everyone Supports Full CTC Expansion
The opposition to fully refundable, universal CTC expansion is not purely cynical, and the arguments deserve fair treatment.
Work incentive effects are real and studied, though contested: Some economic studies found modest reductions in maternal labor supply during the 2021 expansion. The University of Chicago’s Bruce Meyer and Derek Wu estimated the full 2021 expansion would reduce employment among mothers by approximately 1.5 million workers. Other researchers — including Columbia’s Zachary Parolin — found the employment effects near zero or within measurement error. The evidence is genuinely contested, and the work incentive concern is a legitimate trade-off.
The marriage penalty structure is a real design problem: The current CTC structure imposes an effective marriage penalty in some income combinations — two low-income individuals who marry can see their combined household receive less in benefits than they received separately. Fixing this would improve the program’s design without eliminating its antipoverty effectiveness.
The fiscal cost is significant: At full expansion scale, the CTC costs approximately $120 billion per year. The federal budget is not infinitely flexible, and $120 billion is a real number that requires either additional revenue or reduced spending elsewhere.
What these arguments do not resolve is the comparative policy question: the United States currently spends approximately $7.5 trillion per year in total federal spending, maintains a $30+ trillion national debt, allocates trillions to corporate tax preferences and military operations, and tolerates a child poverty rate that costs an estimated $1 trillion annually in downstream economic damage — while the incremental cost of a policy proven to cut child poverty by half is approximately $120 billion per year. The work incentive debate is worth having. It does not, by itself, explain the outcome.
FAQ: Child Poverty and the Child Tax Credit
How many children are in poverty in America in 2025?
Approximately 13–14% of US children — between 9.7 and 11 million children — were living in poverty as of 2024–2025 under the Supplemental Poverty Measure. This is significantly higher than the historic 2021 low of 5.2%. The OBBBA CTC increase is projected to modestly reduce poverty among children in families with earnings, but the 28% of children in the lowest-income households who remain ineligible for the full credit are not expected to see significant improvement. Columbia estimates approximately 5.9 million more children are in poverty than would be the case if the 2021 expanded CTC were still in effect.
Why did child poverty double in 2022?
The primary driver was the expiration of the expanded Child Tax Credit on December 31, 2021. The 2021 expansion raised the credit amount, made it fully refundable, and delivered it as monthly payments — changes that collectively lifted approximately 2.9 million children out of poverty. When the expansion expired, all three changes reversed simultaneously. The Census Bureau’s 2022 SPM data showed child poverty doubling from 5.2% to 12.4% — the largest single-year increase in child poverty ever recorded. Secondary factors included the expiration of other pandemic-era relief programs, but the CTC expiration was the dominant variable in the data.
What does the Child Tax Credit currently pay in 2025?
Under the One Big Beautiful Bill Act signed July 4, 2025, the Child Tax Credit is $2,200 per qualifying child under 17, up from $2,000. The refundable portion is limited to 15% of earned income above $2,500. Families with no or very low earned income receive little or nothing. Approximately 28% of children under 17 are ineligible for the full credit because their families earn too little — the inverse of who needs the credit most.
Does the US spend less on children than other wealthy countries?
Yes, by most measures. OECD data consistently shows the US spending a lower share of GDP on family and child benefits than peer nations. The structural difference: most wealthy democracies provide unconditional universal child benefits to all families — Denmark, Norway, Germany, France, the UK, Australia, Canada, and virtually every other high-income OECD member. The US relies almost entirely on means-tested, income-conditioned programs that exclude the lowest-earning families and require administrative enrollment rather than automatic delivery. The result is both higher child poverty rates and higher downstream economic costs.
Sources & Methodology
Primary data sources:
- Columbia Center on Poverty and Social Policy — child poverty 2021–2024, monthly tracking, 2021 expansion impact, 2024 projections, OBBBA 28% exclusion
- Center on Budget and Policy Priorities — child poverty 5.2% to 12.4%, largest one-year increase, historic low analysis
- Institute on Taxation and Economic Policy — CTC expiration analysis 2023, OBBBA CTC assessment 2026
- Annie E. Casey Foundation — 2023 child poverty data, SPM 13.7%, at least 10 million children in poverty
- Child Trends — approximately 10 million children in poverty in 2023, nearly 1 million more than 2022
- Columbia CPSP — Children Left Behind by OBBBA CTC — 28% of children under 17 ineligible 2025
- McLaughlin & Rank, Journal of Social Work (2018) — annual cost of US child poverty $1.0298 trillion, 5.4% of GDP
- Peter G. Peterson Foundation — $7 government savings per $1 invested in poverty reduction
- CNBC / Senate Finance — August 1, 2024 Senate block of Tax Relief for American Families and Workers Act
- PMC / NIH — Addressing Child Poverty: How Does the United States Compare — OECD comparison, universal vs means-tested structure
- IRS — One Big Beautiful Bill Act provisions — CTC $2,200 signed July 4, 2025
- Census Bureau, Current Population Survey / SPM — annual child poverty statistics by year, race, and state
- Child poverty by race 2023 (SPM): Black 20.7%, Hispanic 22%, American Indian/Alaska Native 19.7%, White 11.2%, Asian 9.9%
- US G7 worst child poverty 20.2%; Denmark 3.7%, Norway 5%, Germany 10.1%, France 11.6% — OECD family database
Methodology: Child poverty statistics cited primarily use the Supplemental Poverty Measure (SPM) unless otherwise noted. The SPM accounts for government assistance (SNAP, housing subsidies, tax credits), taxes, and regional cost-of-living variation. OECD international comparisons use the standard OECD relative poverty definition (households below 50% of median income). The McLaughlin-Rank $1.03 trillion figure uses 2015 data and 2015 GDP baseline. CTC cost estimates (~$120 billion/year at full expansion scale) based on JCT scoring of similar provisions. All legislative vote tallies from official congressional records.