
The commercial real estate collapse of 2026 is not a slow burn — it is a structural implosion unfolding in slow motion, with $1.5 trillion in commercial mortgage-backed securities due for refinancing at interest rates two to three times higher than when they were issued, office vacancy rates at a 40-year high of 22%, and regional banks holding portfolios of distressed commercial real estate loans that would trigger a wave of failures if marked to market. The financial system is pretending this problem does not exist. It does.
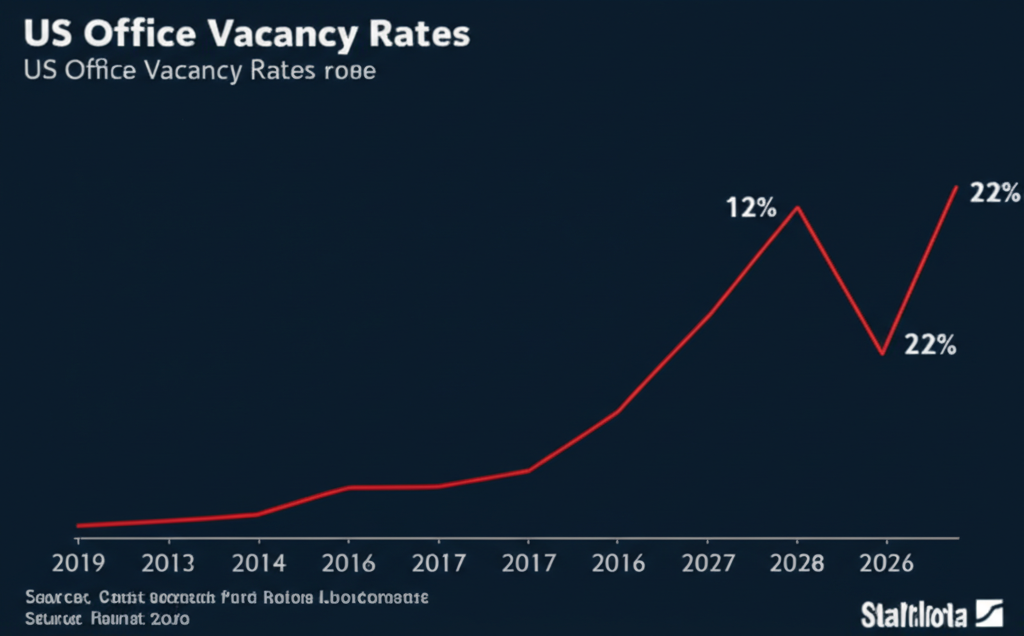
Key Takeaways • US office vacancy hit 22.4% in Q1 2026 — the highest since the S&L crisis of the early 1990s • $1.5 trillion in commercial real estate debt must be refinanced by 2027 — at rates 200-300bps above original issuance • CMBS delinquency rates hit 11.2% in February 2026 — triple the 2019 rate • Public pension funds have 8-12% exposure to CRE — meaning your retirement security is on the line • Cities including San Francisco, Houston, and Chicago face property tax revenue shortfalls of $2-4 billion annually from empty office buildings
The Commercial Real Estate Collapse 2026: What’s Actually Happening
The commercial real estate collapse has been building for six years, but 2026 is the year the math stops working. The proximate causes are well-documented: remote and hybrid work permanently destroyed demand for office space, the Federal Reserve’s 2022-2023 rate hiking cycle doubled the cost of refinancing commercial real estate loans, and a generation of office towers purchased at peak valuations in 2018-2021 is now worth 40-60% less.
The national office vacancy rate hit 22.4% in Q1 2026, according to Cushman & Wakefield — exceeding the peak vacancy rate during the 2008-2009 financial crisis and approaching levels not seen since the Savings & Loan collapse of the early 1990s. In major markets, the numbers are worse: San Francisco’s downtown vacancy rate is 36.7%. Houston is at 28.4%. Chicago’s Loop is at 26.1%. Manhattan, propped up by financial sector demand, is still elevated at 19.2%.
These are not temporary corrections. They are structural changes to the demand for office space that no amount of return-to-office mandates has reversed — because the workers enforcing hybrid arrangements have leverage that workers did not have in 2019, and because companies have realized that office footprint is the most elastic line item in their cost structures. Wall Street’s position in the housing market and its position in the commercial real estate market share the same underlying logic: real estate was a reliable asset class until the assumptions that made it reliable stopped being true.
The commercial real estate collapse is not a story about bad properties. Many of these buildings are architecturally fine. It is a story about a financing structure — short-duration commercial mortgages, routinely refinanced at prevailing rates — that was designed for a world of predictably cheap money and predictably growing office demand. Both conditions have ended.
The $1.5 Trillion CMBS Time Bomb

Commercial mortgage-backed securities — the debt instruments that finance most large commercial real estate — are the mechanism through which this crisis becomes systemic. CMBS work similarly to the residential mortgage-backed securities that blew up in 2008: pools of individual commercial property loans are bundled, tranched by risk level, and sold to investors globally.
The problem is the maturity wall. According to Mortgage Bankers Association data, approximately $1.5 trillion in commercial real estate debt is scheduled to mature between 2025 and 2027. These loans were issued in 2018-2022 when the 10-year Treasury was between 1.5% and 2.5%. The 10-year Treasury today is 4.6%. That’s not a rounding error — it’s the difference between a loan that pencils and one that doesn’t.
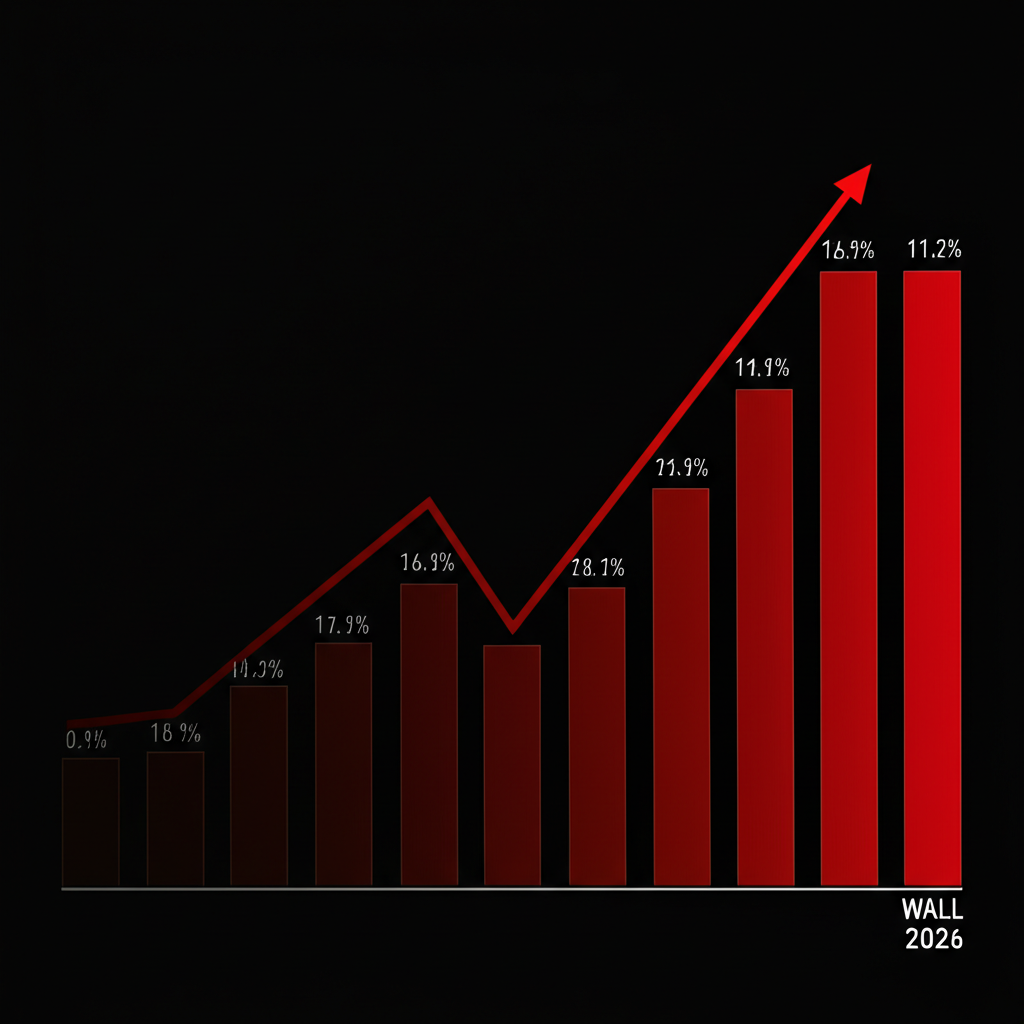
CMBS delinquency rates tell the story clearly. The CMBS delinquency rate hit 11.2% in February 2026, according to Trepp — triple the 2.9% rate of January 2020. Office-specific CMBS delinquencies are running at 17.4%. These are not defaulted loans; many are in “extend and pretend” arrangements where lenders grant short-term extensions rather than force foreclosures that would require them to recognize losses and mark down their books.
“Extend and pretend” is not a solution. It is a delay mechanism that moves losses from 2025 to 2026 to 2027, while accruing interest and management costs on properties that are worth less every quarter.
The extend-and-pretend strategy has limits. It requires ongoing agreement between the borrower and lender, it only works while the property is generating enough cash flow to service operating costs, and it ends abruptly when a major tenant vacates or a loan cannot be further extended. Banks are already beginning to take CRE-related write-downs: New York Community Bank (now Flagstar) disclosed $2.4 billion in CRE-related losses in 2025. Pacific Premier Bancorp, Western Alliance, and Valley National Bancorp have all flagged elevated CRE exposure in their 2026 earnings calls.
The gutting of the CFPB in 2026 has further reduced the oversight apparatus watching these stress points — exactly the regulatory clearing out that preceded the 2008 crisis. The playbook is not new.
Who’s Holding the Bag: Banks, Pension Funds, and You
The commercial real estate collapse would be manageable if its losses were cleanly concentrated in the institutions that made the loans. They are not. The exposure is distributed across the financial system in ways that connect this crisis to your retirement account, your municipal tax base, and your bank deposits.
Regional banks are the most directly exposed. According to Federal Reserve data, commercial real estate loans represent 28.4% of total assets at small and mid-sized banks (those under $250 billion in total assets) — compared to 6.8% at the four largest banks. This asymmetry means the commercial real estate collapse is primarily a threat to the banking system’s middle tier: the 4,700 community and regional banks that serve most of America’s small businesses, rural areas, and mid-sized cities.
Public pension funds are the less-discussed exposure. Pension funds — the retirement vehicles covering 14.7 million public employees including teachers, firefighters, and municipal workers — allocate 8-12% of assets to commercial real estate. The California Public Employees’ Retirement System (CalPERS), the largest US pension at $496 billion, reported a 6.2% loss on its real estate portfolio in fiscal year 2025. The New York State Common Retirement Fund’s real estate portfolio returned -4.7% in 2025. The New Jersey Division of Investment’s real estate allocation was down 8.1%.
These losses feed directly into the public pension underfunding crisis that was already a $1.3 trillion time bomb before the commercial real estate collapse accelerated. Every percentage point of CRE loss at a pension fund increases the unfunded liability that younger taxpayers will eventually be asked to fill. The pension crisis and the CRE crisis are the same crisis at different points on the timeline.
For individuals with 401(k) accounts, the exposure is less direct but still real. Wall Street extracts $50 billion annually in hidden 401(k) fees, much of which funds the financial engineering that created the CMBS market. Real estate investment trusts (REITs) — held in many index funds and 401(k) portfolios — have significant office sector exposure. Vanguard’s Real Estate ETF (VNQ), held in millions of retirement accounts, is down 22% since January 2025.
The City Budget Crisis Nobody Is Talking About
The fiscal impact of the commercial real estate collapse on city governments is a crisis hiding inside another crisis. Commercial property tax is the primary revenue source for most major American cities — and it is assessed based on property valuations that, in most jurisdictions, lag market values by two to five years. The losses that have already happened in commercial real estate have not yet shown up in city budgets. When they do, they will hit simultaneously.
San Francisco’s commercial property tax revenue fell 19% in fiscal year 2026, contributing to a $780 million budget deficit that has triggered cuts to libraries, public health clinics, and homelessness services. Chicago’s Loop office district valuation fell 34% in its most recent reassessment — a $1.8 billion reduction in the city’s taxable base. Houston, already dealing with energy-sector office vacancy, faces a $2.1 billion cumulative property tax revenue shortfall through 2028 under current assessment trends.
The downstream effects of shrinking city budgets are not abstract. They are school budgets, transit funding, pothole repair, and emergency services. The commercial real estate collapse is a mechanism for transferring losses from real estate investors and their lenders to the residents of the cities those buildings are in. The people who benefit least from the commercial real estate boom are the ones whose services get cut when the bust arrives.
This connects to the broader pattern documented in the NIMBY housing zoning analysis: decisions about land use and real estate made primarily by asset-owning older generations have costs that fall primarily on younger, renting, city-dependent populations. The commercial real estate collapse is the same dynamic applied to the office market.
Why Remote Work Made This Permanent, Not Temporary
The commercial real estate industry has spent three years waiting for the office demand recovery. The recovery is not coming at the scale needed to absorb existing supply.
The data is definitive. Kastle Systems, which tracks office badge swipe data across 2,600 buildings in 138 cities, reports that average US office utilization has plateaued at 47-51% of pre-pandemic levels since early 2024 — despite aggressive return-to-office mandates from Amazon, JPMorgan, Goldman Sachs, and the federal government under DOGE directives. The plateau is the signal. If return-to-office mandates from the most powerful employers in the country cannot push occupancy above 55%, nothing will.
The structural reasons are well-documented. First, office utilization is now bimodal: Tuesday through Thursday are near-capacity, Monday and Friday are empty. Buildings designed for 5-day utilization cannot be made economically viable on 3-day peaks. Second, companies that right-sized their office footprint in 2021-2023 are not expanding again — they have learned that their businesses run effectively with less space. Third, the talent competition dynamic that made office mandates costly to enforce has not meaningfully changed: engineers, analysts, and knowledge workers with in-demand skills still have leverage.
The office vacancy rate is not going back to 12%. It is going to 25%, possibly higher in secondary markets. The commercial real estate industry’s baseline assumption — that this is a cyclical downturn rather than a structural shift — is how the S&L crisis was described in 1986.
The Counterargument: ‘The Market Will Adapt’
The standard counterargument to the commercial real estate collapse narrative is conversion: office buildings that can’t fill with office tenants will be converted to residential, hotel, laboratory, or life sciences use, recapturing value and reducing vacancy. There is something to this — office-to-residential conversions are happening in major cities, and some buildings are genuinely well-suited for adaptive reuse.
But the counterargument overstates the conversion opportunity. Most office buildings are structurally, mechanically, and geometrically unsuited for residential conversion. The deep floor plates (60-100 feet from core to exterior) that make efficient offices make terrible apartments — most units would have no exterior windows. The mechanical systems, elevator cores, and plumbing risers are designed for office use patterns, not residential. Converting a 1970s office tower to apartments costs $300-$600 per square foot in most markets, which only pencils in the highest-rent cities.
The math is also against scale. There are 5.5 billion square feet of office space in the United States. Even optimistic conversion projections suggest 100-200 million square feet could be economically converted by 2030 — less than 4% of the total. The remaining 96% has to either find office tenants, be demolished, or sit vacant and depreciate. “The market will adapt” is a process that takes 15-20 years and destroys enormous amounts of capital in the meantime.
The argument that losses will be absorbed without systemic consequences also ignores the banking transmission mechanism. Individual property owners can absorb losses gradually. Banks with concentrated CRE loan portfolios cannot — mark-to-market losses above their capital buffers trigger regulatory action. The Iran war’s simultaneous pressure on 401(k) values and the commercial real estate collapse are compounding stresses on a financial system that was not stress-tested for both simultaneously.
What the Commercial Real Estate Collapse Means for Your City

The commercial real estate collapse does not land evenly. Its consequences depend heavily on a city’s economy, its downtown’s dependence on office workers, and the composition of its property tax base. Understanding the local dimension matters.
| City | Office Vacancy Rate Q1 2026 | Estimated Annual Tax Revenue Loss | Key Risk Factor |
|---|---|---|---|
| San Francisco | 36.7% | $1.1B+ | Tech sector remote-first; values fell 50-65% |
| Chicago | 26.1% | $890M | Loop concentration; pension fund double exposure |
| Houston | 28.4% | $780M | Energy sector vacancy + oil price volatility |
| Washington DC | 23.8% | $650M | Federal tenant consolidation under DOGE |
| New York City | 19.2% | $2.1B | Largest absolute loss; financial sector partially insulates |
| Los Angeles | 24.6% | $920M | Entertainment + tech; conversion costs high |
| Denver | 21.3% | $380M | Energy + startup sector; secondary market pressure |
The populations most exposed to the commercial real estate collapse’s downstream effects are concentrated in urban cores: renters who depend on city services funded by property tax revenue, public employees whose pension funds have CRE exposure, and small business owners who rely on foot traffic from office workers. The asset owners who benefited from the office boom have already taken their gains and distributed them to shareholders. The same pattern that produced SNAP cuts to fund war spending applies here: the losses are socialized while the gains were privatized.
Frequently Asked Questions
Is the commercial real estate collapse worse than 2008?
In the office sector specifically, yes — the vacancy rate in 2026 exceeds the peak of the 2008-2009 financial crisis. However, the overall CRE market is more complex: retail and industrial real estate are in significantly better shape than office. The systemic risk is also distributed differently: in 2008, the exposure was concentrated in too-big-to-fail institutions; in 2026, it is concentrated in regional and community banks, which creates a different failure mode — more diffuse but potentially affecting more communities.
Will my bank fail because of commercial real estate?
The largest US banks (JPMorgan, Bank of America, Wells Fargo, Citigroup) have limited CRE exposure relative to their capital buffers and are unlikely to face existential risk from the commercial real estate collapse alone. Regional and community banks with CRE concentrations above 300% of their capital — the regulatory threshold for heightened scrutiny — face material risk. The FDIC’s list of problem banks reached 68 institutions in Q4 2025, the highest since 2015, with CRE cited as the primary concern.
Are my retirement savings at risk from commercial real estate?
If your 401(k) includes a REIT fund or a broad real estate allocation, it has already absorbed losses: the FTSE Nareit All Equity REITs index is down 24% from its 2022 peak. Public pension funds have 8-12% CRE exposure and have reported significant losses, which will increase the unfunded liabilities that younger taxpayers face. If your 401(k) is primarily in broad equity index funds without significant real estate sector overweight, your direct CRE exposure is modest.
What happens to empty office buildings long-term?
Long-term, empty office buildings face three fates: conversion (residential, hotel, life sciences — economically viable only for 5-10% of the stock), demolition (expensive and rarely undertaken voluntarily), or slow-motion deterioration (the most common outcome, where buildings lose tenants, cut services, and eventually become functionally obsolete). Urban cores with high concentrations of empty office towers face cycles of blight that take 15-25 years to resolve — as documented by the aftermath of the 1990s office glut in Houston, Denver, and Dallas.
Sources and Methodology
Data in this article draws from: Cushman & Wakefield Q1 2026 US Office MarketBeat report (vacancy rates); Trepp CMBS Research February 2026 (delinquency rates); Mortgage Bankers Association Commercial Real Estate Finance Forecast 2025-2027 (maturity wall estimates); Federal Reserve Flow of Funds Z.1 (bank CRE exposure); CalPERS, NYSCRF, NJDOI annual reports (pension fund real estate returns); Kastle Systems Back to Work Barometer March 2026 (office utilization); FDIC Quarterly Banking Profile Q4 2025 (problem bank list); Urban Land Institute “Office Conversion Feasibility” 2025 (conversion cost estimates).


