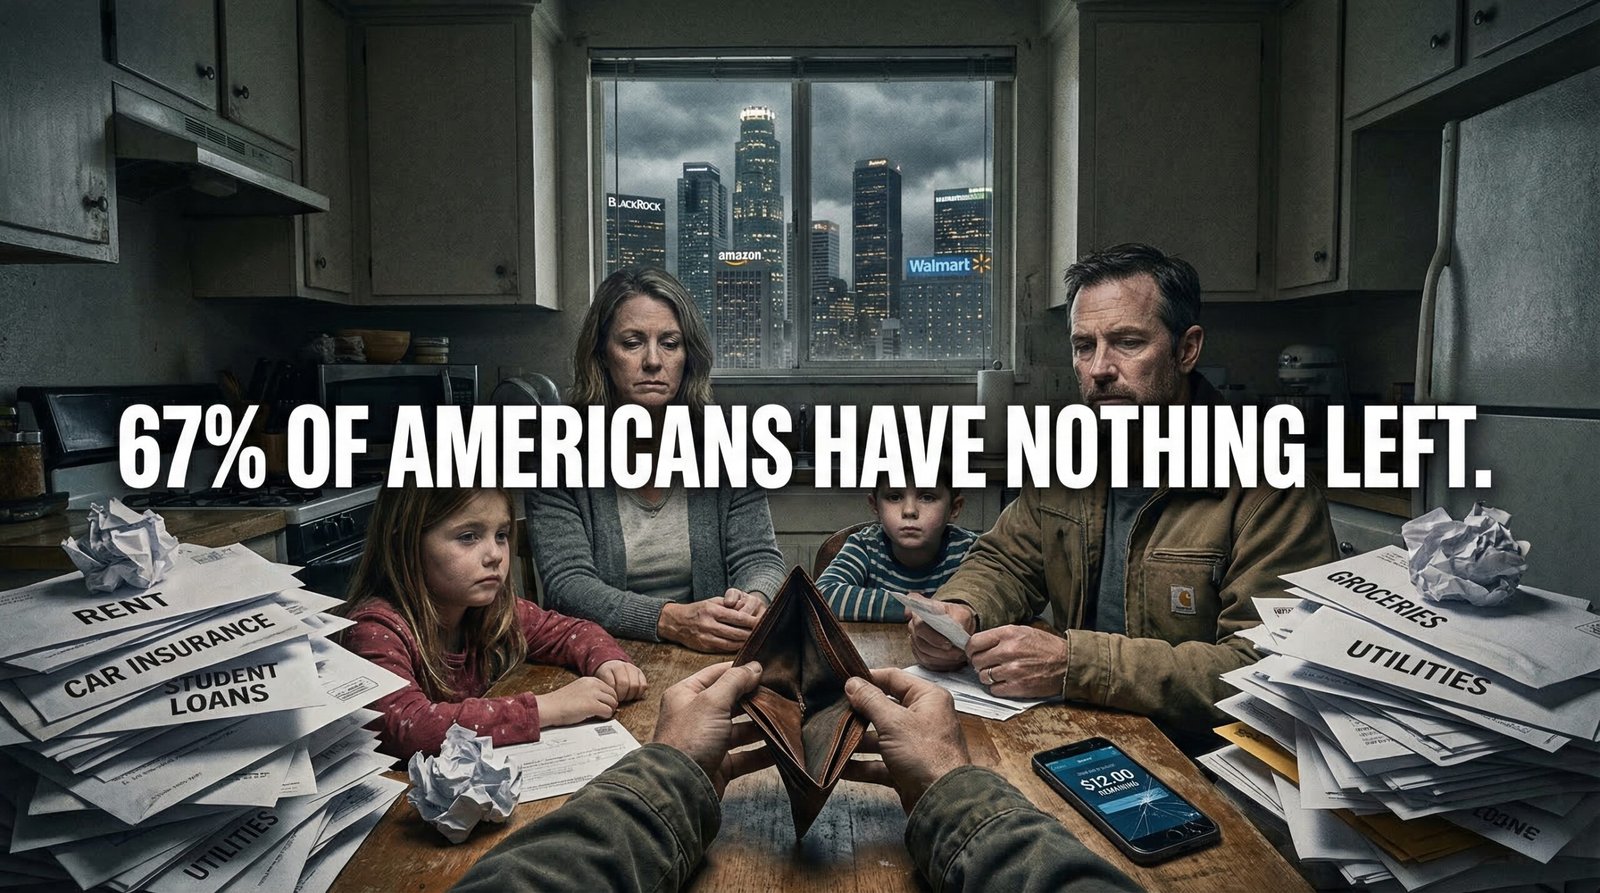
Between 62% and 67% of Americans are living paycheck to paycheck in 2025, depending on who’s counting and how — and the share has risen consistently for the past three years. Even with different methodologies, every credible survey points to the same reality: the majority of American workers are one bad week from financial crisis. This isn’t a savings discipline problem. It is the arithmetic result of four decades of policy choices that separated wage growth from productivity gains, eliminated defined-benefit pensions, deregulated housing and healthcare markets, and systematically defunded every public institution designed to buffer economic shocks — while making it a federal crime to form a union without legal combat.
Key Takeaways
- Between 62% and 67% of Americans report living paycheck to paycheck in 2025, according to PYMNTS/LendingClub and Investopedia surveys — up from 58–63% in 2022 and 65% in 2024. The share living paycheck to paycheck “out of necessity” (not lifestyle) jumped from 29% in December 2024 to 40% in December 2025, per PYMNTS. Even using the narrower Bank of America Institute definition (necessity spending exceeds 95% of income), roughly 24–29% of households qualify — up from 2019.
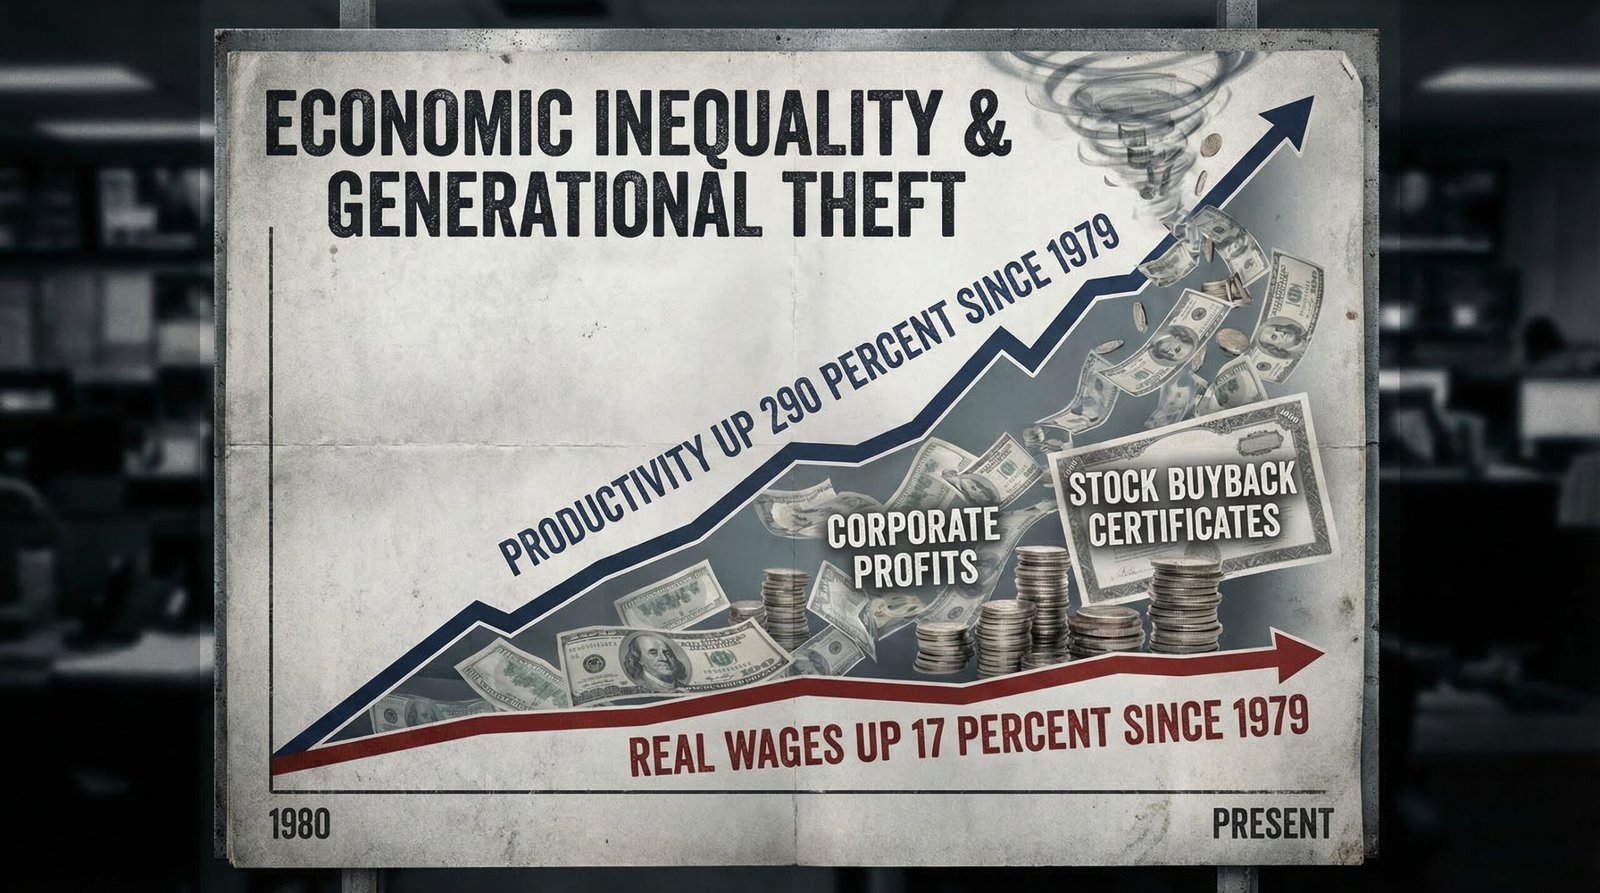
- This is not a mystery. Since 1979, US worker productivity increased 290% while real wages for non-supervisory workers rose just 17%. The entire difference went to corporate profits and shareholder returns — enabled by the 1982 legalization of stock buybacks, Reagan-era union-busting, and the deliberate policy choice to tie compensation to “market forces” while tying CEO pay to share price. Every dollar of productivity workers didn’t receive in wages is a structural cause of living paycheck to paycheck.
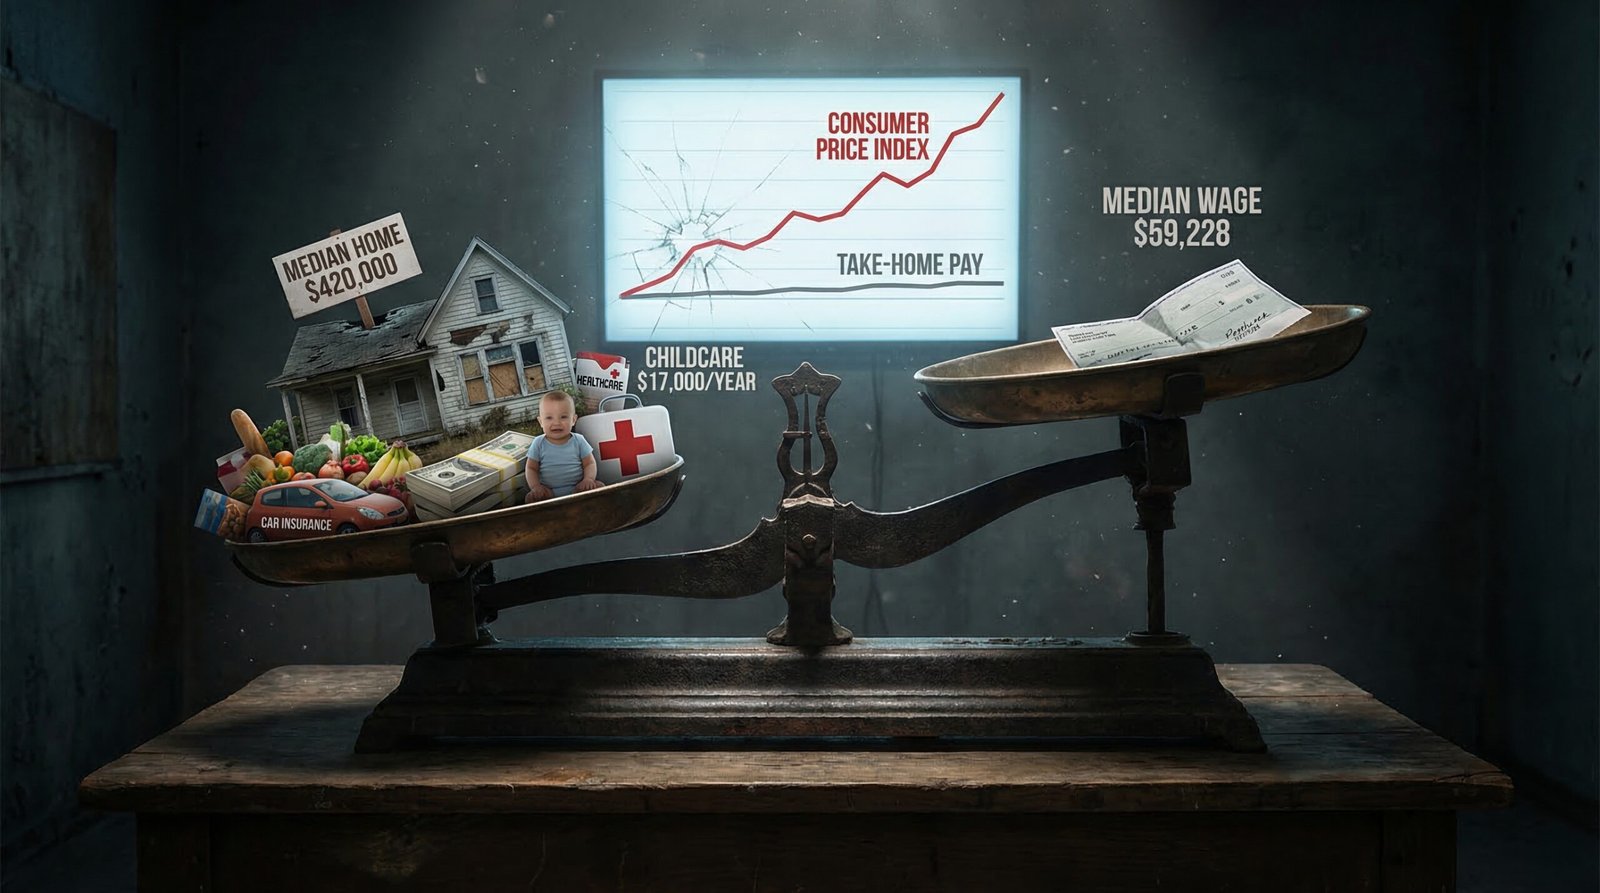
- 36% of Americans earning $100,000–$200,000 per year report living paycheck to paycheck, according to PYMNTS/LendingClub. Even 36% of those earning over $200,000 report the same. This is not primarily “lifestyle creep.” In 176 metropolitan areas, a six-figure income is now required to buy a typically priced home with a 10% down payment — up from just 30 metro areas in 2019. Housing alone consumes 51% of income for Millennials in many markets. A $100,000 salary in 2000 would require $183,000 in 2024 to have equivalent purchasing power. The floor moved while the ceiling stayed.
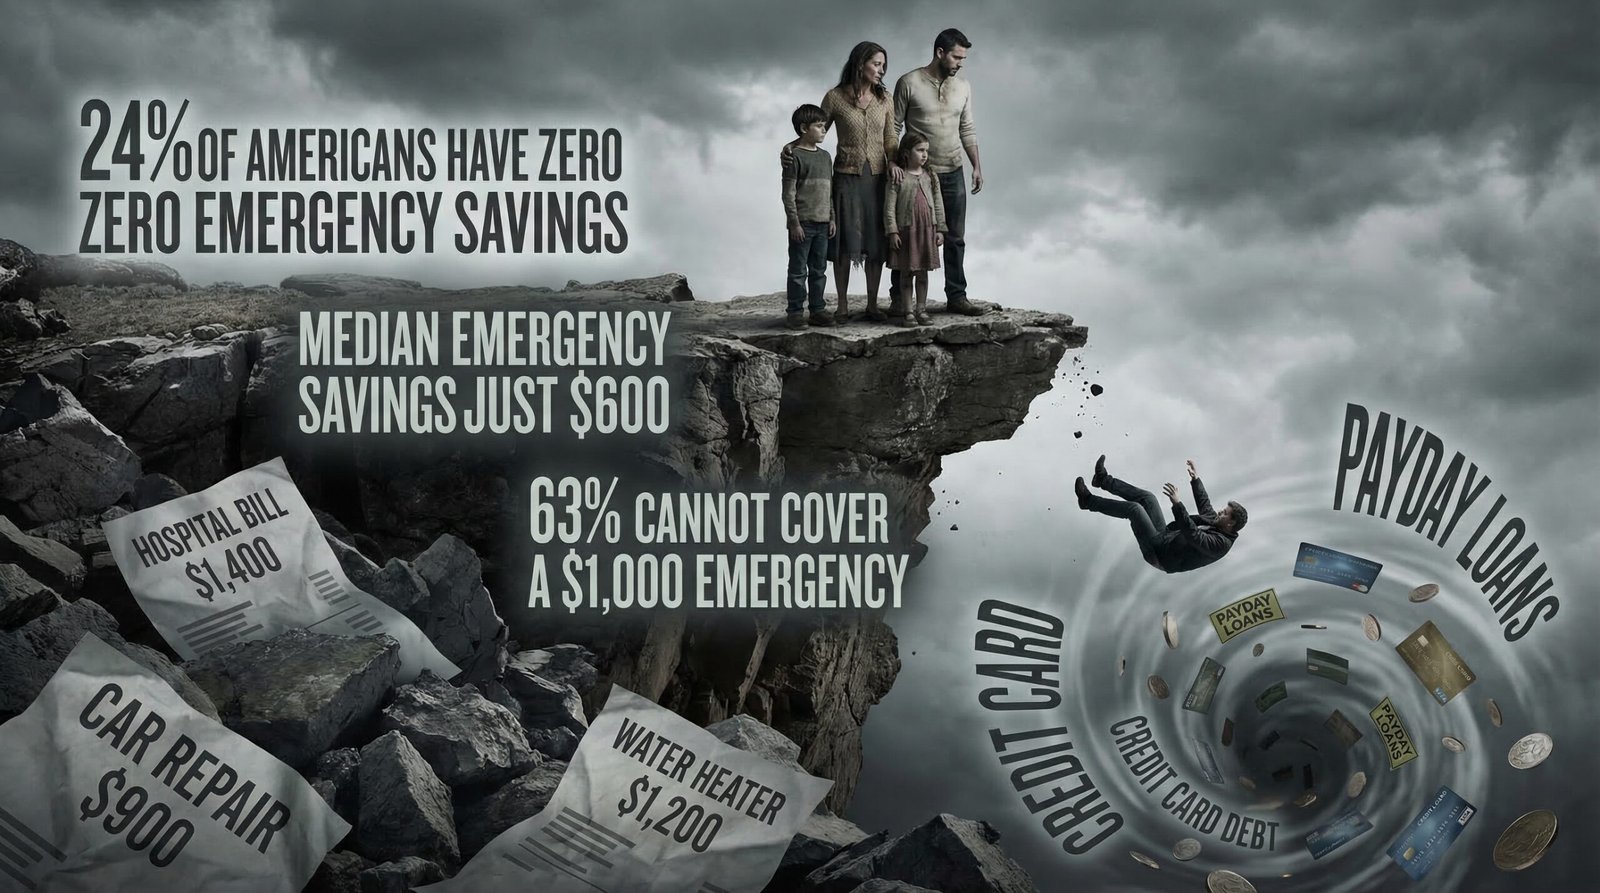
- 24% of Americans have zero emergency savings (Bankrate 2026), and 43% say they could not cover a $1,000 unexpected expense from savings. The median emergency savings balance in America is $600 — less than one month of minimum wage work. Over a third of Americans say they couldn’t cover even one month of living expenses. The Federal Reserve’s 2024 SHED report found that 37% of adults could not cover a $400 emergency expense without borrowing or selling something. When paycheck-to-paycheck living is the norm, an emergency is a debt sentence.
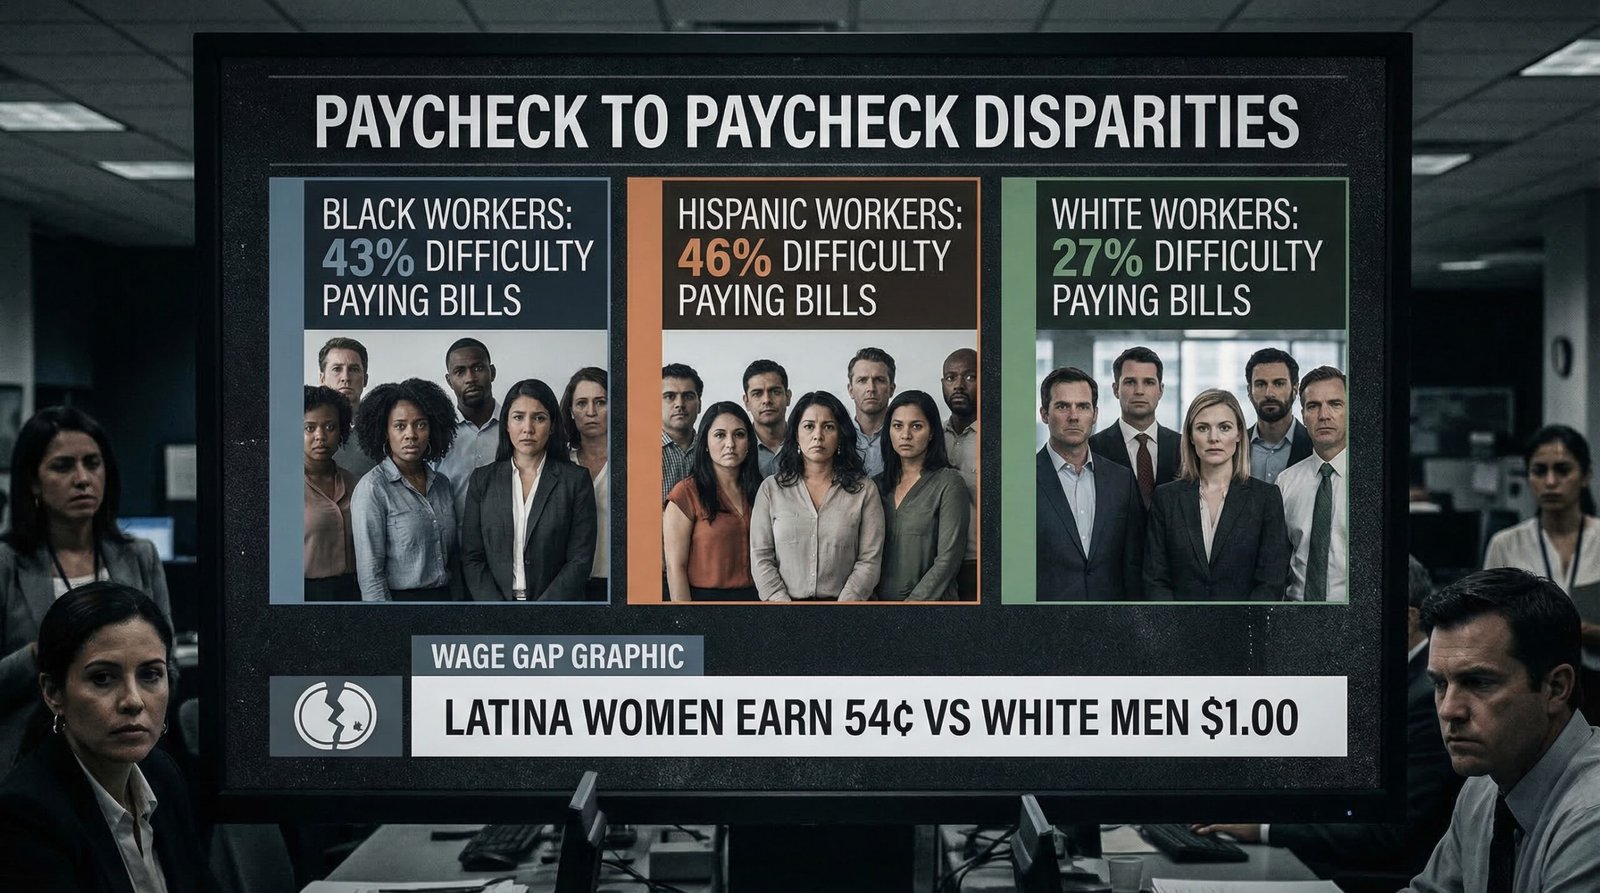
- The demographic burden is not evenly distributed. 43% of Black adults and 46% of Hispanic adults reported difficulty paying bills due to cost of living in 2024, versus 27% of white adults (EPI/Federal Reserve SHED). Black women’s wages were 31% below white men’s; Latina women’s wages 43% below. Black workers’ wages fell 3.3% in 2024 in real terms. Millennials lead all generations with 45% living paycheck to paycheck (Goldman Sachs 2025). The racial wealth gap rooted in redlining and GI Bill exclusion compounds into every monthly budget.
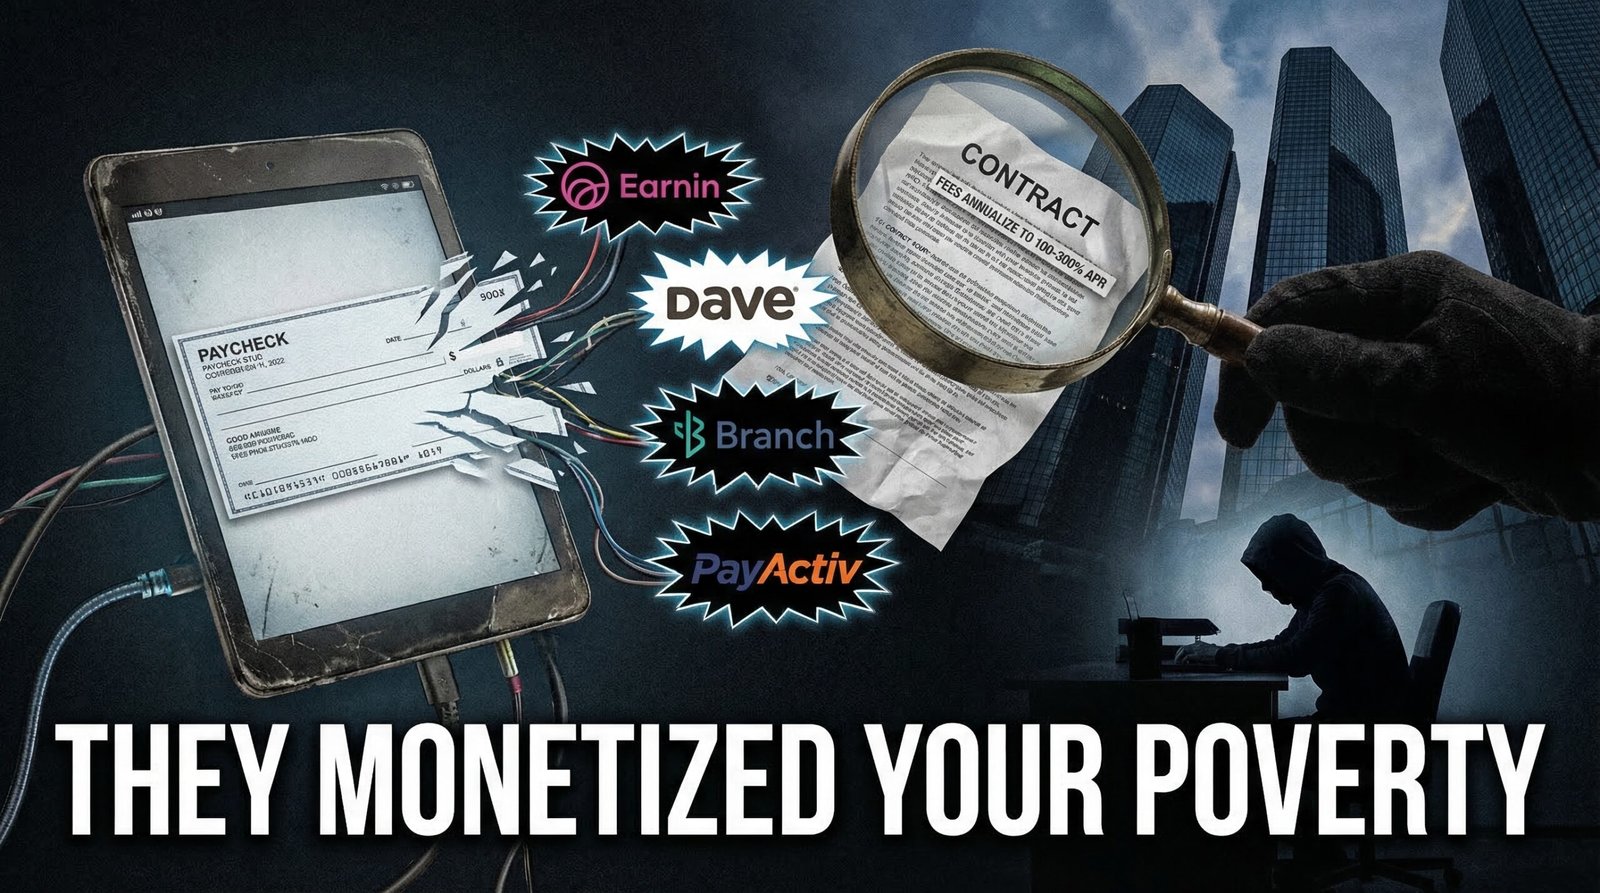
- The paycheck-to-paycheck economy has spawned an entire predatory industry designed to extract fees from the financially desperate: payday loans at 391% APR, earned wage access (EWA) apps that charge $1.99–$3.99 “tips” per advance (annualizing to 100–330% APR), overdraft fees ($35 per transaction), credit card interest compounding on essentials, and “buy now pay later” products that fracture grocery bills into debt. JPMorgan Chase, Wells Fargo, and Bank of America collected a combined $4.6 billion in overdraft fees in 2023 — almost entirely from people who could least afford to pay.
How Many Americans Are Actually Living Paycheck to Paycheck?
The headline numbers vary because researchers define “living paycheck to paycheck” differently — and that definitional debate is itself revealing. The narrowest and most rigorous definition comes from the Bank of America Institute, which tracks households where necessity spending (housing, groceries, gas, utilities, insurance) exceeds 95% of income, leaving essentially no capacity to save. By this measure, about 24–29% of households qualify in 2025 — and that number has risen every year since 2019.
The broader and more commonly cited surveys — PYMNTS/LendingClub, FinFit, Investopedia — use self-reported agreement with the statement “I live paycheck to paycheck.” These consistently find 62–67% of Americans in that category in 2025. The PYMNTS “Reality Check” series, which surveys over 3,000 consumers monthly, found 65% in December 2024, rising to 67% by mid-2025. FinFit’s “Inside the Wallets of Working Americans” found three-quarters of all workers living paycheck to paycheck, with 78% of full-time workers in that category — a figure that has climbed for three consecutive years.
Critically, PYMNTS distinguishes between living paycheck to paycheck by choice (high earners who spend aggressively) and by necessity (those who have no choice). The necessity rate — the genuinely trapped — jumped from 29% in December 2024 to 40% by December 2025. That 11-point jump in a single year represents roughly 36 million additional Americans who crossed from “tight budget” to “no margin at all.” The timing maps precisely onto the collapse in real wage growth (only 1 in 5 workers saw pay increases that outpaced inflation in 2025), the renewed housing cost spike, and the persistence of food and insurance inflation.
The trend is unambiguous: the personal savings rate — the percentage of disposable income Americans actually save — was 17% in 1975 and roughly 6–7% in the early 2000s. It collapsed to a multi-decade low of 2.4% in mid-2023 before recovering slightly to around 4.4% in 2024. For context: Americans are saving less than 5% of income annually despite being told that a 3–6 month emergency fund (roughly 25–50% of annual income saved) is the minimum standard of financial stability. The gap between that standard and the current savings rate is not a character flaw. It is the arithmetic gap between what Americans earn and what the American economy now costs.
What Happened to Wages? How 45 Years of Policy Choices Gutted the Paycheck
The Economic Policy Institute has documented one of the most important and underreported economic facts of the last half-century: since 1979, US worker productivity increased approximately 290% — and real wages for non-supervisory workers rose approximately 17%. Read that again. The workers who generated nearly three times the economic output receive barely any of the additional value they created. The gap — the $270+ of productivity per dollar of wage increase — went somewhere. It went to profit margins, executive compensation, and stock buybacks ($942 billion in 2024 alone).
This didn’t happen by accident. It was the result of a specific sequence of policy decisions:
- 1981: PATCO and Reagan’s union destruction. When Reagan fired 11,345 striking air traffic controllers, it sent an unmistakable signal to every employer in America: the federal government will not protect collective bargaining. Union membership, which had stood at 35% of the private workforce in 1954, began a decline that now sits below 6% in the private sector. Research consistently shows that union membership is the single strongest predictor of higher wages for non-college-educated workers — and its destruction is the single strongest structural cause of wage stagnation.
- 1982: Stock buybacks legalized (SEC Rule 10b-18). Before 1982, stock buybacks were legally treated as market manipulation. The Reagan SEC legalized them under Rule 10b-18, creating a direct incentive for corporate management to return cash to shareholders rather than raise wages, invest in R&D, or maintain pension obligations. By 2024, American corporations were buying back nearly a trillion dollars of their own stock annually — money that could have funded wage increases for every employee of those companies.
- 1983–2000: Minimum wage erosion. The federal minimum wage has been $7.25/hour since 2009 — the longest stretch without an increase in history. Adjusted for inflation, the federal minimum wage peaked in 1968 at approximately $13.68 in 2024 dollars. If the minimum wage had kept pace with productivity since 1968, it would be approximately $24/hour today. Instead, it sits at $7.25, and 29 states have no minimum wage above the federal floor. The generational politics of minimum wage policy are explicit: Boomer-era voters who had already climbed the income ladder consistently opposed minimum wage increases that would reduce their relative advantage and increase consumer goods costs they didn’t need to minimize.
- 2000: China PNTR and the manufacturing collapse. The permanent normal trade relations agreement with China accelerated the destruction of 3.7 million manufacturing jobs between 2000 and 2019, concentrated in working-class communities that had no replacement for them. Manufacturing jobs had been the anchor of middle-class wages for workers without college degrees. Their disappearance didn’t just eliminate jobs — it eliminated entire wage-floor industries that pulled up surrounding wages through competition for workers.
The result of these compounding policy choices: only 1 in 5 workers in 2025 reports pay increases that kept pace with or exceeded inflation over the prior year (USA Today/Ludwig Institute). The cost of a basic but secure American life rose 4.4% in 2024 alone (Ludwig Institute for Shared Economic Prosperity), outpacing both headline inflation and median wage growth. When the cost of being alive rises faster than your income, every year makes the paycheck-to-paycheck trap tighter — not because you spent on luxuries, but because the necessities cost more.
Why Does $100,000 Feel Like Nothing? The Six-Figure Paycheck-to-Paycheck Trap
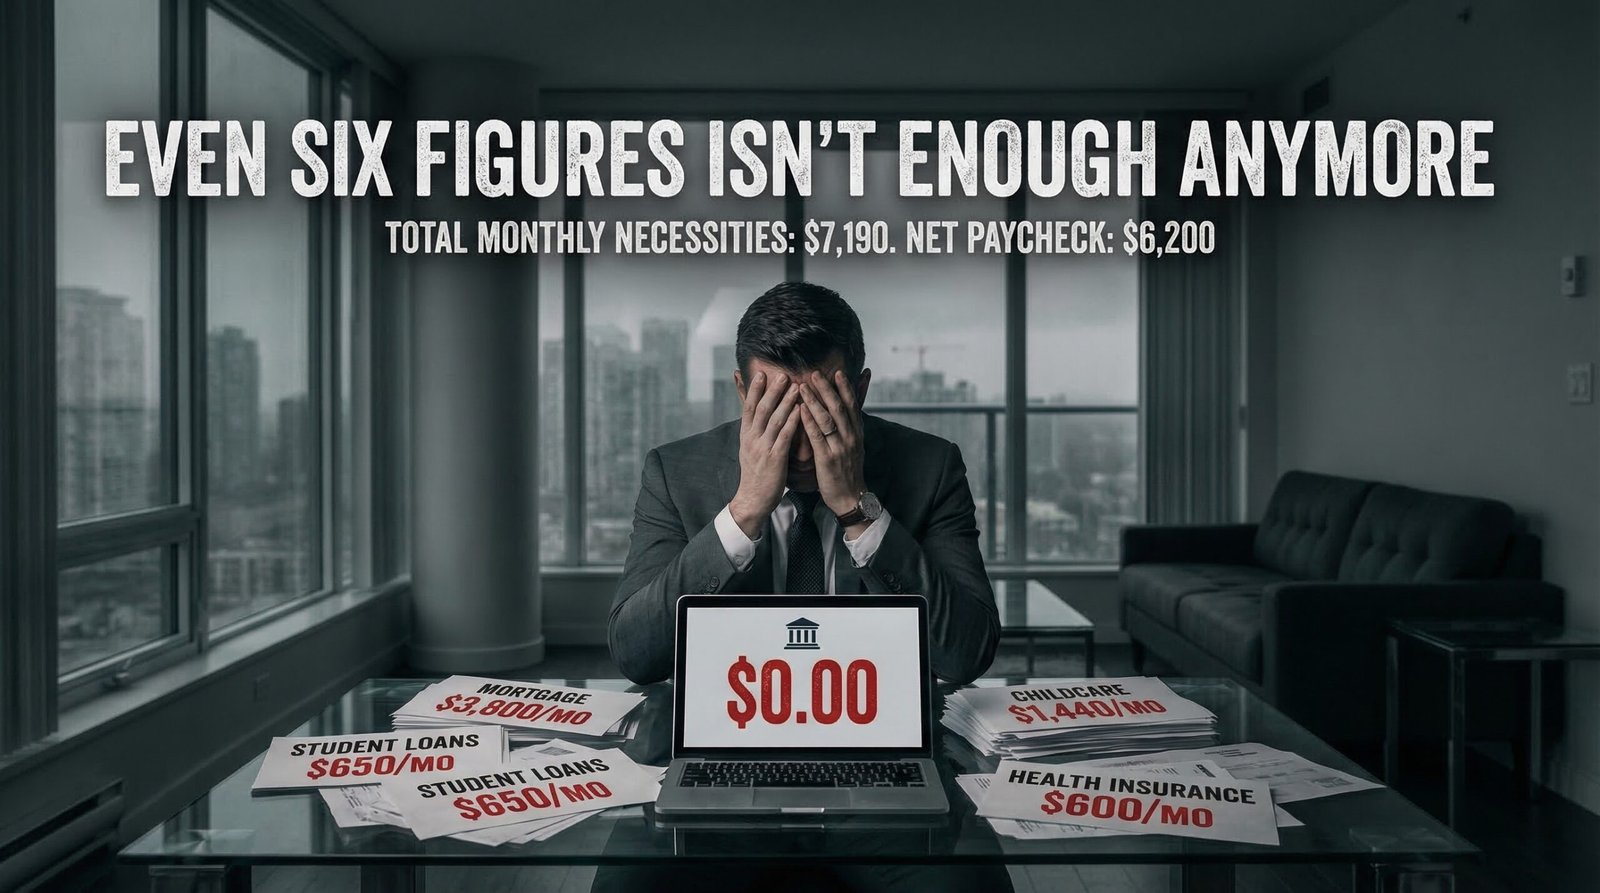
One of the most counterintuitive — and politically significant — findings of the paycheck-to-paycheck research is that the phenomenon extends well into six-figure incomes. 36% of households earning $100,000–$200,000 and even 36% of those earning over $200,000 report living paycheck to paycheck, according to PYMNTS/LendingClub. This is partially lifestyle creep — high earners spending commensurate with their income on premium goods and experiences — but it is increasingly also structural necessity.
Consider a dual-income household in a major metropolitan area, earning a combined $120,000 — the 75th percentile of US household income. After federal and state taxes, their take-home is roughly $88,000 ($7,333/month). Now run the math on 2026 necessity costs in that metro:
- Mortgage/rent: $3,000–$3,800/month (median home payment or comparable rent in 176 metros now requiring $100K+ income to buy)
- Childcare: $1,440/month average nationally ($17,264/year for infant care, up 263% since 1990)
- Car payments + insurance: $1,100/month (two used cars + insurance at the national average $2,144/year)
- Student loans: $650/month (average for both borrowers at combined $70,000 balance)
- Health insurance (employer plan + premiums): $600/month employee share
- Groceries: $900/month for a family of four (BLS CPI data)
- Utilities: $300/month
Total: $8,090–$8,890/month in necessities alone against a $7,333 take-home paycheck. This isn’t a spending problem. This is a structural cost problem. The household in this scenario is not buying luxury goods — they are buying shelter, food, transportation, healthcare, education debt service, and childcare. Every one of those costs has been systematically inflated by policy failures: NIMBY zoning blocking housing supply, private equity buying up daycare chains, mandatory car insurance premiums up 55%, student loan debt rising without wage returns.
A $100,000 salary in 2000 would require $183,000 in 2024 dollars to have equivalent purchasing power. But that’s just the headline CPI measure. The cost of housing has risen 5–6x faster than general CPI in most metros; childcare has risen roughly 7x since 1990; prescription drug prices have risen 1,000%+ for brand-name drugs; car insurance premiums are up 55% since 2020 alone. The six-figure paycheck-to-paycheck phenomenon is not a behavior anomaly — it is the predictable math of what happens when all necessary expenditures rise faster than income, for everyone.
Who Gets Hit Hardest? The Race, Gender, and Generation Divide
Living paycheck to paycheck is not an equal-opportunity affliction. While the phenomenon has expanded into the middle and upper-middle class, the severity of its impact — and the structural causes — vary enormously by race, gender, and generation.
Race. In 2024, 43.27% of Black adults and 46.30% of Hispanic adults reported difficulty paying their monthly bills due to cost of living (Economic Policy Institute, Federal Reserve SHED data) — compared to approximately 27% of white adults. This is not a coincidence. It is the compounding effect of the racial wealth gap built by federal policy: Black veterans excluded from the GI Bill’s homeownership provisions (2 of 3,229 FHA loans in Mississippi went to Black veterans in the postwar period), HOLC redlining mapping Black neighborhoods as D-rated investment risks, and systematic exclusion from union membership in the industries where organized labor lifted working-class wages in the 1940s through 1970s. Black workers’ wages fell 3.3% in real terms in 2024 — not held steady, not grew slower, but actually declined. Black women earn approximately 69 cents for every dollar earned by white men; Latina women earn 54 cents.
Generation. Goldman Sachs’s 2025 Retirement Survey found 45% of Millennials living paycheck to paycheck — the highest rate of any generation — followed by Gen X at 41% and Gen Z at 39%. LendingClub data from 2023 found 73% of Millennials and 66% of Gen Z in paycheck-to-paycheck status. The Millennial paycheck problem is structurally different from the Boomer paycheck problem of the 1980s: Boomers entering the workforce in the 1970s could buy a median-priced home for roughly 3x their annual income; Millennials entering in the 2000s and 2010s face a ratio of 7–9x in most major metros. The millennial retirement savings crisis flows directly from this: when 51% of income goes to housing, there is no margin for retirement savings regardless of financial discipline.
Single parents and women. Single-parent households — the majority of which are headed by women — face the sharpest exposure to paycheck-to-paycheck living, because they bear the full cost of housing, childcare, healthcare, and transportation on a single income in a country where none of those costs have been socialized. The average cost of infant care at $17,264/year effectively eliminates the earned income advantage of going back to work for many single parents in lower-wage jobs. The choice between working and paying for childcare that costs more than the paycheck is not a personal finance failure. It is a policy failure in a country that provides 0 weeks of federally mandated paid family leave and has no universal pre-K program.
The Emergency Savings Void: How One Flat Tire Becomes a Debt Spiral
The cruelest feature of paycheck-to-paycheck living is not the zero-margin month — it’s what happens when the unexpected arrives. And in America in 2026, it always does. The Federal Reserve’s 2024 SHED report found that 37% of adults could not cover a $400 emergency expense using cash or its equivalent (unchanged from 2022 and 2023 — three consecutive years of the same crisis). The median emergency savings balance in America is $600. The U.S. News 2026 Financial Wellness Survey found that 43% of Americans say they have no emergency fund at all, and one-third could not cover even one month of living expenses from savings.
The math is devastating when applied to real-world scenarios:
- Flat tire + tow: $300–$500 → covered by 63% of Americans from cash; the other 37% put it on a credit card at 23% APR or take a payday advance
- Emergency room visit: $1,200–$2,500 after insurance → 43% of Americans cannot cover from savings; goes to medical debt
- Car repair: $900 → 43% cannot cover → same spiral
- Three-day illness/missed work: 33% of American workers have no paid sick leave → 3 missed work days = 3/5 of a biweekly paycheck → rent comes up short
- Job loss: average UI benefit replacement rate is 45% of prior wages for those who qualify; roughly 40% of unemployed workers don’t qualify. With median savings of $5,400 for adults under 35 and $600 in emergency funds, the median unemployed Millennial has 2–3 weeks of runway before financial crisis.
The emergency savings void is not random. It was created by dismantling the public infrastructure that used to buffer it. In 1950, union membership was near 35% — meaning collective bargaining agreements typically included severance, sick leave, defined-benefit pensions, and healthcare continuity. By 2025, private sector union membership is below 6%. The gig economy’s deliberate misclassification of workers as independent contractors eliminates unemployment insurance eligibility entirely. COBRA health insurance continuation requires workers to pay 100–102% of the employer-sponsored plan cost on a reduced or zero income — pricing most recently laid-off workers out of healthcare within days. Each of these systems was weakened during the Boomer-dominated political era, and each weakening ratchets the paycheck-to-paycheck trap one click tighter.
76% of employees report that financial stress negatively impacts their work output. The American Psychological Association’s annual Stress in America survey has listed finances as the #1 source of stress in America for 15 consecutive years. A Nature Scientific Reports study found a direct correlation between financial asset levels and depression and anxiety — not just at the poverty line, but across the income spectrum. Every dollar of additional financial margin reduces measurable psychological distress. The paycheck-to-paycheck crisis is not just an economic policy failure — it is a public health crisis that has been directly measurable for years while Congress voted itself raises and passed stock buyback deregulation.
Who Profits From Your Paycheck-to-Paycheck Life?
Here is the part of the living paycheck-to-paycheck story that doesn’t get enough attention: the financial precarity of the American worker is not just an externality — it is a profit center. Multiple entire industries exist specifically to monetize the gap between what people earn and what they need to pay:
Overdraft fees. JPMorgan Chase, Bank of America, and Wells Fargo collected a combined $4.6 billion in overdraft fees in 2023 — fees charged almost exclusively to people who had nothing left in their account. The average overdraft fee is $35 per transaction. The CFPB estimated that overdraft fees cost Americans $15.5 billion annually, disproportionately extracted from low-income customers who can least absorb them. The Biden-era CFPB capped overdraft fees at $5–$14; the gutting of the CFPB in 2026 reversed this cap, restoring the full $35-per-transaction extraction machine.
Earned Wage Access (EWA) apps. Earnin, Dave, Branch, Brigit, PayActiv, and dozens of similar apps have raised a combined $3+ billion in venture capital to build one product: access to wages you have already earned but haven’t yet been paid. The pitch is financial wellness. The business model is charging $1.99–$3.99 per advance, asking for “tips” that function as interest, and offering subscription “memberships” at $8–$15/month. Annualized, the fees on a typical advance of $100 for 10 days range from 73% to 330% APR — higher than most credit cards, approaching payday loan territory. The CFPB, before its gutting, was in the process of classifying EWA products as credit and subjecting them to Truth in Lending Act disclosures. That process was halted.
Buy Now Pay Later (BNPL). Affirm, Klarna, Afterpay, and PayPal Pay Later have collectively extended BNPL credit to hundreds of millions of consumers — now, increasingly, for grocery and utility payments rather than consumer discretionary items. When BNPL is being used to pay for eggs and electricity, it is not a convenience feature. It is a debt product filling the gap that wages should fill. Late fees and interest on BNPL products are not always disclosed clearly at the point of purchase, and multiple concurrent BNPL obligations are nearly impossible for consumers to track against their total debt load.
Credit card interest on necessities. The average credit card interest rate reached 22–23% in 2024–2025 — the highest in the post-deregulation era. When Americans put grocery bills and car insurance on credit cards because the checking account runs out before the next paycheck, those necessities compound at 22% annually. The credit card industry’s lobbying machine successfully blocked the Credit Card Competition Act, which would have introduced competition into card processing networks and potentially reduced interest rates. The industry spent $430 million lobbying against it over two years. The gap between 22% credit card interest and the federal funds rate is pure extraction from people who borrow out of necessity, not preference.
The Counter-Argument: Personal Responsibility and Lifestyle Creep
The personal responsibility counter-argument is not completely without merit — and it deserves engagement rather than dismissal. Some portion of paycheck-to-paycheck living, particularly at higher income levels, does reflect what behavioral economists call “lifestyle creep”: income rises and spending rises to match it, often on non-essential goods. Research does show that many Americans report living paycheck to paycheck while also holding Netflix subscriptions, dining out regularly, and owning more cars than their household needs. The PYMNTS data itself distinguishes “paycheck to paycheck by necessity” from “paycheck to paycheck by choice.”
There are also genuine behavioral interventions that help: automated savings contributions, high-yield savings accounts, budgeting discipline, and avoiding high-fee financial products. For workers in the $60,000–$100,000 range in lower-cost metros, genuine financial margin is possible with deliberate choices. Dave Ramsey has built a billion-dollar media business on this truth, and it is not entirely wrong.
Where the argument fails: Behavioral solutions cannot fix structural problems at scale. For the 40% of Americans living paycheck to paycheck by necessity — the people whose necessity spending already exceeds their income — there is no budgeting advice that closes the gap. Telling a nurse in Los Angeles who earns $72,000, spends $2,600/month on rent for a one-bedroom, and has $180,000 in student loans to “cut the lattes” is not serious economic analysis. It is a way of converting a policy failure into a character indictment so that the people who created the policy failure don’t have to answer for it. The productivity-wage gap is not fixed by compound interest calculators. The minimum wage is not fixed by personal savings rates. NIMBY zoning is not reversed by budgeting apps. The causes are structural. The solutions must be structural. Individual discipline is necessary but not sufficient — and for the bottom half of the income distribution, it isn’t even close to sufficient.
FAQ: Living Paycheck to Paycheck
What does living paycheck to paycheck actually mean?
It means having no meaningful financial buffer between your income and your expenses — that if your paycheck was delayed or missed, you could not cover your necessary costs from savings. The technical Bank of America Institute definition is households where necessity spending exceeds 95% of income; the self-reported definition is simply the experience of having nothing left after essential bills are paid. Both definitions are capturing something real: a structural absence of financial margin that leaves workers one missed paycheck, one medical bill, or one car repair from financial crisis.
Why are so many Americans living paycheck to paycheck even with high employment?
Because employment and wage adequacy are different things. The US unemployment rate in 2025 was below 4.5% — historically low. But the Ludwig Institute’s True Rate of Unemployment, which includes involuntary part-time workers and discouraged workers who stopped looking, ran significantly higher, at 28–29% for Black and Hispanic workers. More importantly, the issue is not whether people have jobs — it’s whether those jobs pay enough to cover the cost of existing in America. Forty years of wage stagnation relative to productivity, combined with accelerating costs for housing, healthcare, childcare, and education, have created a structural gap between what full-time employment pays and what a secure American life costs. Full employment with inadequate wages produces exactly the paycheck-to-paycheck crisis we are measuring.
How do I stop living paycheck to paycheck?
The honest answer depends on why you’re in the situation. For people at higher income levels with genuine discretionary spending that could be redirected: automate savings before you can spend them (payroll deduction into a high-yield savings account), eliminate high-fee products (overdraft protection, EWA apps, payday advances), and prioritize eliminating high-interest consumer debt before building non-emergency savings. For people at lower income levels where necessity spending genuinely exceeds income, the solutions are structural and political rather than behavioral: union membership, minimum wage increases, housing subsidy access, Medicaid enrollment, SNAP, LIHEAP, childcare subsidy programs, and income-driven student loan repayment are more materially impactful than any personal budget hack. Check your eligibility for every program in your state — many Americans leave significant money on the table simply due to not knowing they qualify.
Is living paycheck to paycheck worse now than it was for Boomers?
Structurally, yes — by most measurable indicators. Boomers entering the workforce in the 1970s faced high inflation, but also: union membership at 25–35% providing collective wage floors, federal minimum wage at $13.68 in today’s dollars, median home prices at 3x annual income rather than 7–9x, near-zero student debt burden, employer-sponsored defined-benefit pensions covering 38% of private sector workers (vs 15% today), and Medicare and Medicaid programs that hadn’t yet been structurally weakened. The 401k replacing the pension transferred investment risk onto workers. The housing market becoming the primary wealth-building vehicle for Boomer homeowners meant that the same policy decisions that enriched homeowners (NIMBY zoning, mortgage interest deduction) actively harmed younger renters trying to enter the market. The comparison is not a contest of suffering — it’s a factual accounting of structural differences that explains why Millennials and Gen Z face a harder financial environment than their parents did at the same age, even with comparable education levels and work ethic.
Sources & Methodology
Primary sources: Investopedia: 67% of Americans Living Paycheck to Paycheck in 2025 (up from 63% in 2024); Bank of America Institute: Paycheck to Paycheck — Slowing But Growing, 2025 (29% lower-income households, 24% all households, necessity spending >95% definition); PYMNTS: Running on Empty — Paycheck-to-Paycheck Necessity Rate 29% to 40% Dec 2024–Dec 2025; ACA International / PYMNTS Reality Check 2024: 65% of consumers paycheck to paycheck, 78% of full-time workers; Goldman Sachs 2025 Retirement Survey: 45% Millennials, 41% Gen X, 39% Gen Z paycheck to paycheck; LendingClub 2023: 73% of Millennials, 66% of Gen Z paycheck to paycheck; Federal Reserve SHED 2024: 37% of adults cannot cover $400 emergency expense from cash; Bankrate 2026 Emergency Savings Report: 24% Americans have zero emergency savings; Empower: Median emergency savings $600, 37% cannot afford $400 expense; US News 2026 Financial Wellness Survey: 43% no emergency fund, 1 in 3 cannot cover one month of expenses; EPI: 43.27% Black adults, 46.30% Hispanic adults difficulty paying bills 2024; US DOL Women’s Bureau: Wage gaps — Black women 31%, Latina women 43% below white men; Ludwig Institute for Shared Economic Prosperity: Cost of basic American life +4.4% in 2024, outpacing wages and headline CPI; USA Today: Only 1 in 5 workers saw pay increases exceeding inflation in 2025; National Housing Conference: 176 MSAs require six-figure income to buy typically-priced home with 10% down, up from 30 in 2019; Remitly / Bureau of Economic Analysis: Personal savings rate under 5% in 2024, down from 17% in 1975; EPI Productivity-Pay Gap: Productivity +290% since 1979, real wages for non-supervisory workers +17%; Federal minimum wage $7.25 since 2009, equivalent to $13.68/hour in 1968 dollars (inflation-adjusted); PYMNTS/LendingClub: 36% of $100K–$200K earners paycheck to paycheck; $100K in 2000 = $183K in 2024 (BLS CPI calculator); Bankrate average credit card interest rate 22–23% in 2024–2025; CFPB overdraft fee data: $15.5 billion annually, top 3 banks $4.6 billion in 2023; CFPB EWA APR analysis: $100 advance for 10 days at $3.99 fee = 145% APR.