The oil shock 2026 generational inequality story is hiding in plain sight: Brent crude hit $92.69 a barrel on Friday — up 27% since the Iran war began nine days ago — and the S&P 500 Energy Sector has returned 32.67% over the past year. Baby boomers own 50% of energy and utility stocks. Millennials and Gen Z together hold just 10.5% of all U.S. wealth despite being the largest population cohort, and they spend up to 17.8% of their income on energy. The war a boomer-dominated political class chose to start is printing dividends for the generation that owns the oil. You’re paying at the pump.
Key Takeaways
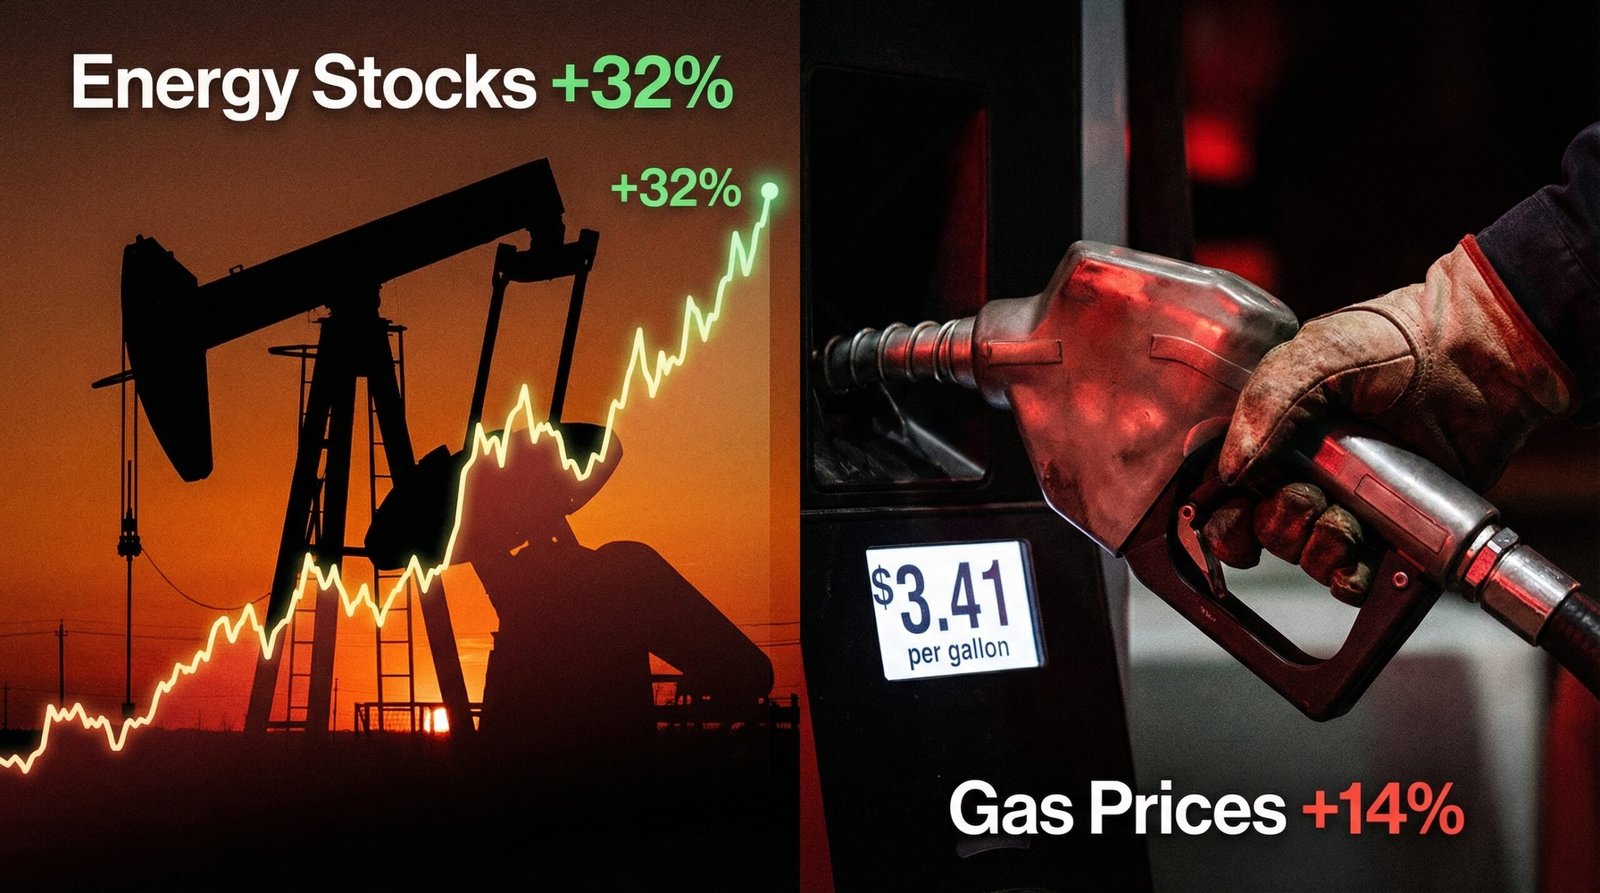
• Brent crude hit $92.69/barrel on March 7 — up 27% in 9 days since the Iran war began
• The S&P 500 Energy Sector is up 32.67% over the past year; XLE ETF up 52% from its 52-week low
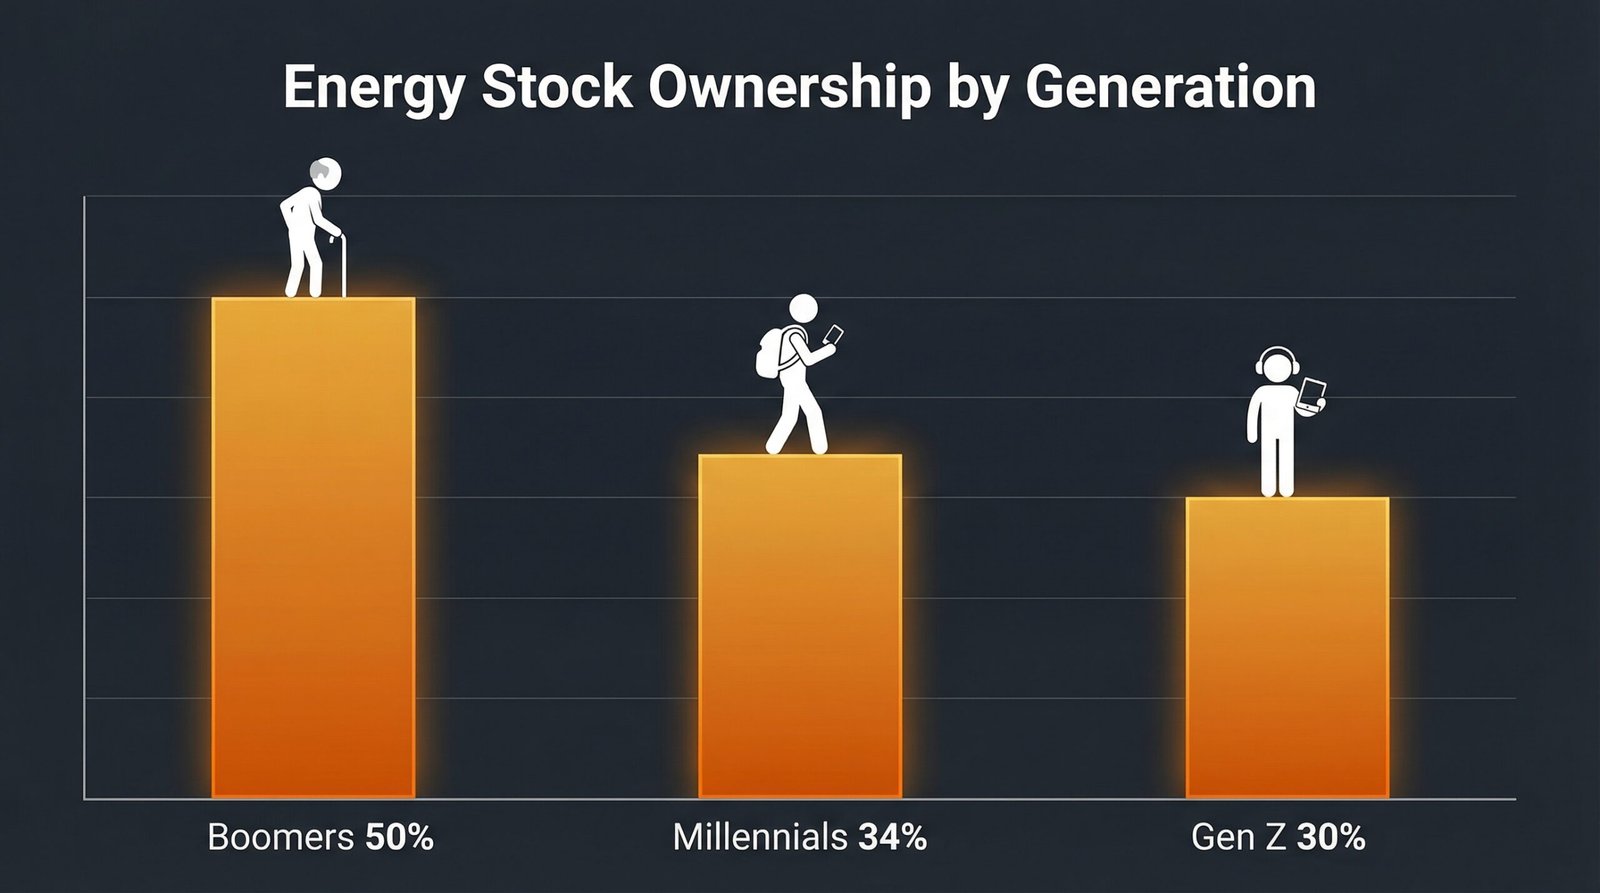
• Baby boomers own 50% of energy and utility stocks — nearly double the Gen Z rate (30%)
• Americans over 55 own 73–75% of the entire stock market, up from 52% in 1992
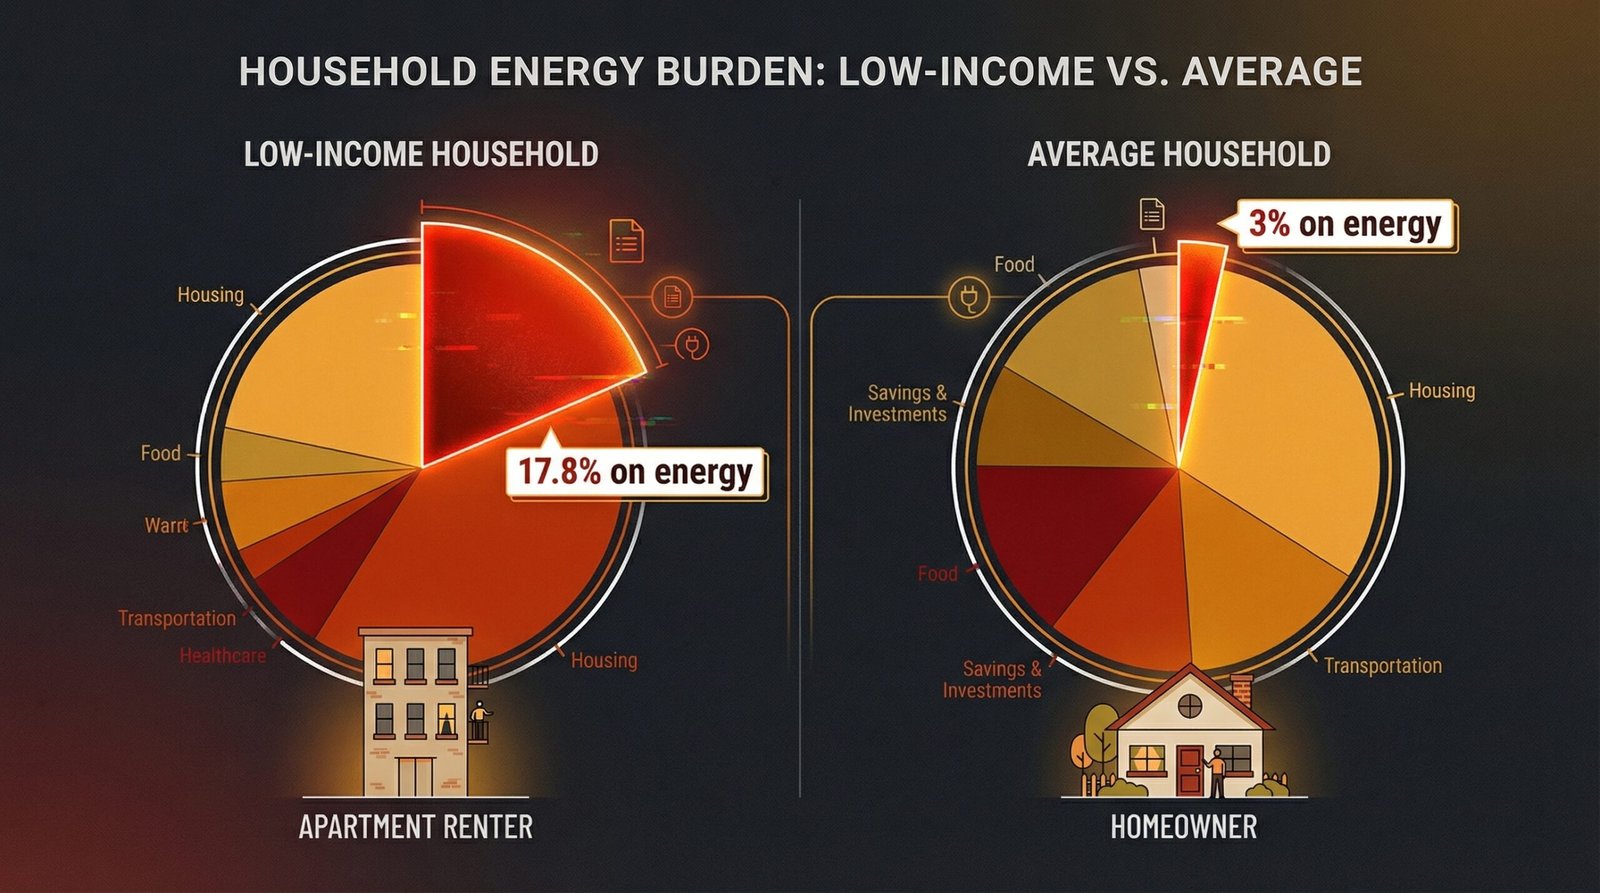
• Low-income households spend 17.8% of their income on energy — more than 3x the national average
• Millennials and Gen Z together hold just 10.5% of total U.S. wealth despite being the largest population cohort
• Gas prices hit $3.41/gallon nationally on March 7 — an 11% jump in 9 days, highest since 2024
• The war is projected to cost $6 billion in its first week alone per Pentagon officials — supplemental funding request coming
Who Actually Owns the Oil Stocks?
Let’s start with the basic structural fact that explains why the Iran war’s inflation shock hits different depending on your birth year.
According to The Motley Fool’s 2025 Generational Investing Trends Survey, 50% of baby boomers own energy and utility stocks — compared to 34% of millennials and just 30% of Gen Z. That gap isn’t accidental. It reflects four decades of compounding wealth through dividend-paying blue-chip positions that younger workers simply haven’t had the income or time horizon to accumulate.
The broader stock ownership picture is even more lopsided. Americans over age 55 now own approximately 73–75% of the entire U.S. stock market — up from just 52% in 1992. The top 10% of Americans own 87–93% of all stocks. The bottom 50% own 1%. Baby boomers alone control 53% of all corporate equities. As the American energy independence myth unravels in real time, the generation that built that myth is positioned to profit from its collapse.
The energy sector’s biggest names — ExxonMobil (XOM), Chevron (CVX), ConocoPhillips (COP) — are classic boomer retirement portfolio staples. These are dividend machines: XOM yields ~3.3%, CVX ~4.3%, and energy MLPs like Enterprise Products Partners yield 7%+. Financial advisors have been recommending energy stocks to boomer retirees for decades precisely because they produce reliable income regardless of market conditions. War, it turns out, is extremely reliable income production for oil companies.
Meanwhile, millennials and Gen Z together hold just $17.1 trillion in total wealth — 10.5% of the national total — despite being the largest population cohort. Their financial exposure to the oil sector is overwhelmingly on the cost side of the ledger, not the income side.

How Much Did Energy Stocks Surge Since the Iran War Started?
The numbers are not subtle. Since the U.S. and Israel launched Operation Epic Fury on February 28, energy stocks have done what energy stocks always do when bombs start falling in oil-producing regions: they go up.
The S&P 500 Energy Sector (^GSPE) has returned 32.67% over the past year as of March 5 — making it the best-performing major sector while the broader S&P 500 fell 0.8% in February alone. The Energy Select Sector SPDR ETF (XLE) — which is 42.5% ExxonMobil and Chevron — is up 52% from its 52-week low, trading around $56–57 in early March 2026.
Brent crude, the international benchmark, has gone from roughly $72.74 on March 1 to $92.69 by March 7 — a 27% increase in nine days. WTI settled at $90.90 on Friday, up 12.2% on the week. Goldman Sachs warned $100/barrel is possible “within days.” The White House says the disruption will last “weeks, not months.” The market is betting weeks is an undercount.
For context: the Iran war 401k story is complicated — defense stocks soared while broad market indices took hits. But the energy sector is clean, simple winner territory. Whoever owns XOM, CVX, COP, or XLE has been printing money since February 28. That is, overwhelmingly, older, wealthier Americans.
In the 2022 Russia-Ukraine oil shock, the top five oil companies collectively earned $400 billion in combined profits — their most profitable year in history. ExxonMobil booked $55.7 billion in annual profit. Chevron posted $36.5 billion. The 2026 Iran war carries higher disruption potential due to Hormuz exposure, which the Russia shock did not.
Who Pays the Gas Bill? The Income Burden Divide
The national average for regular unleaded gasoline hit $3.41/gallon on March 7 — up 43 cents (14%) from $2.98/gallon in late February, and the highest price since September 2024. California is already above $4.35. Pennsylvania: $3.55. The AAA national average jumped 27 cents in a single week ending March 5 — the sharpest weekly jump since 2022.
For the average household driving ~1,100 miles per month at ~28 MPG, that’s roughly $17 more per month on gas — or about $200 annualized at current prices. If Brent hits $100, analysts estimate the national average reaches $3.80–4.20/gallon. That’s not nothing for a median millennial renter earning $58,000.
But averages lie. The real story is in the income-burden math:
- Low-income households (disproportionately millennials, Gen Z, and renters) spend 17.8% of their total income on energy bills and transportation fuel — more than three times the national average, per the American Council for an Energy-Efficient Economy (ACEEE).
- Approximately 1 in 7 American families live in energy poverty, defined as spending 14%+ of income on energy (Rocky Mountain Institute).
- Before the Iran war, the EIA projected gas would consume less than 2% of disposable income in 2026 — citing it as a 20-year low. That projection is now inoperative.
- The White House’s FY2026 budget proposed eliminating all $4 billion in LIHEAP funding — the Low-Income Home Energy Assistance Program — which helps 6 million low-income households pay their energy bills.
The policy configuration is: start a war that spikes gas prices, eliminate the program that helps poor people pay their energy bills, and watch energy stockholders collect dividends. That’s not a conspiracy theory. It’s a budget document and a stock ticker in the same sentence.
This is the same dynamic playing out across the broader stagflation 2026 trap: prices rise for inputs (energy, food, goods), wages don’t keep pace, and the pain concentrates in households that hold costs, not assets. Older, wealthier households hold energy assets. Younger households hold energy costs.

The Math: What the Oil Shock Costs Each Generation
Here’s the structural asymmetry in a single table. On one side: what the oil shock does for energy stock holders. On the other: what it does to people paying for energy.
| Metric | Baby Boomers | Millennials / Gen Z |
|---|---|---|
| % who own energy stocks | 50% | 30–34% |
| Share of total stock market owned | 53% (age 55+: 73–75%) | ~7% |
| Total wealth held | $77 trillion (51% of U.S.) | $17.1 trillion (10.5%) |
| Median net worth (Federal Reserve SCF) | $410,000–$432,200 | $39,040–$135,100 |
| Energy sector 1-year return (XLE) | +52% (asset holder benefit) | +52% (mostly not a holder) |
| Energy burden as % of income | ~3% (higher income, lower burden) | Up to 17.8% (low-income skew) |
| War debt (first week: $6B) | Smaller share via tax base | Larger future-debt burden |
Boomers hold $77 trillion in total wealth (51.1% of all U.S. wealth), with the top 10% of boomer households controlling nearly three-quarters of that — roughly $58 trillion. That wealth is heavily invested in dividend-generating assets, including energy. Every $10 rise in oil prices is an appreciation event for that portfolio and a squeeze event for a millennial who drives 45 minutes to work because they can’t afford to live near the office.
The war generating those dividends is being paid for by taxpayers who skew younger. The Iran war costs roughly $1 billion per day. Pentagon officials disclosed to Congress this week that the first week cost approximately $6 billion — with $4 billion in munitions and missile interceptors alone. A supplemental budget request is coming. That debt lands on the generational ledger of people already carrying $1.7 trillion in student loans, median home prices above $400,000, and now a gas bill that jumped 14% in nine days.
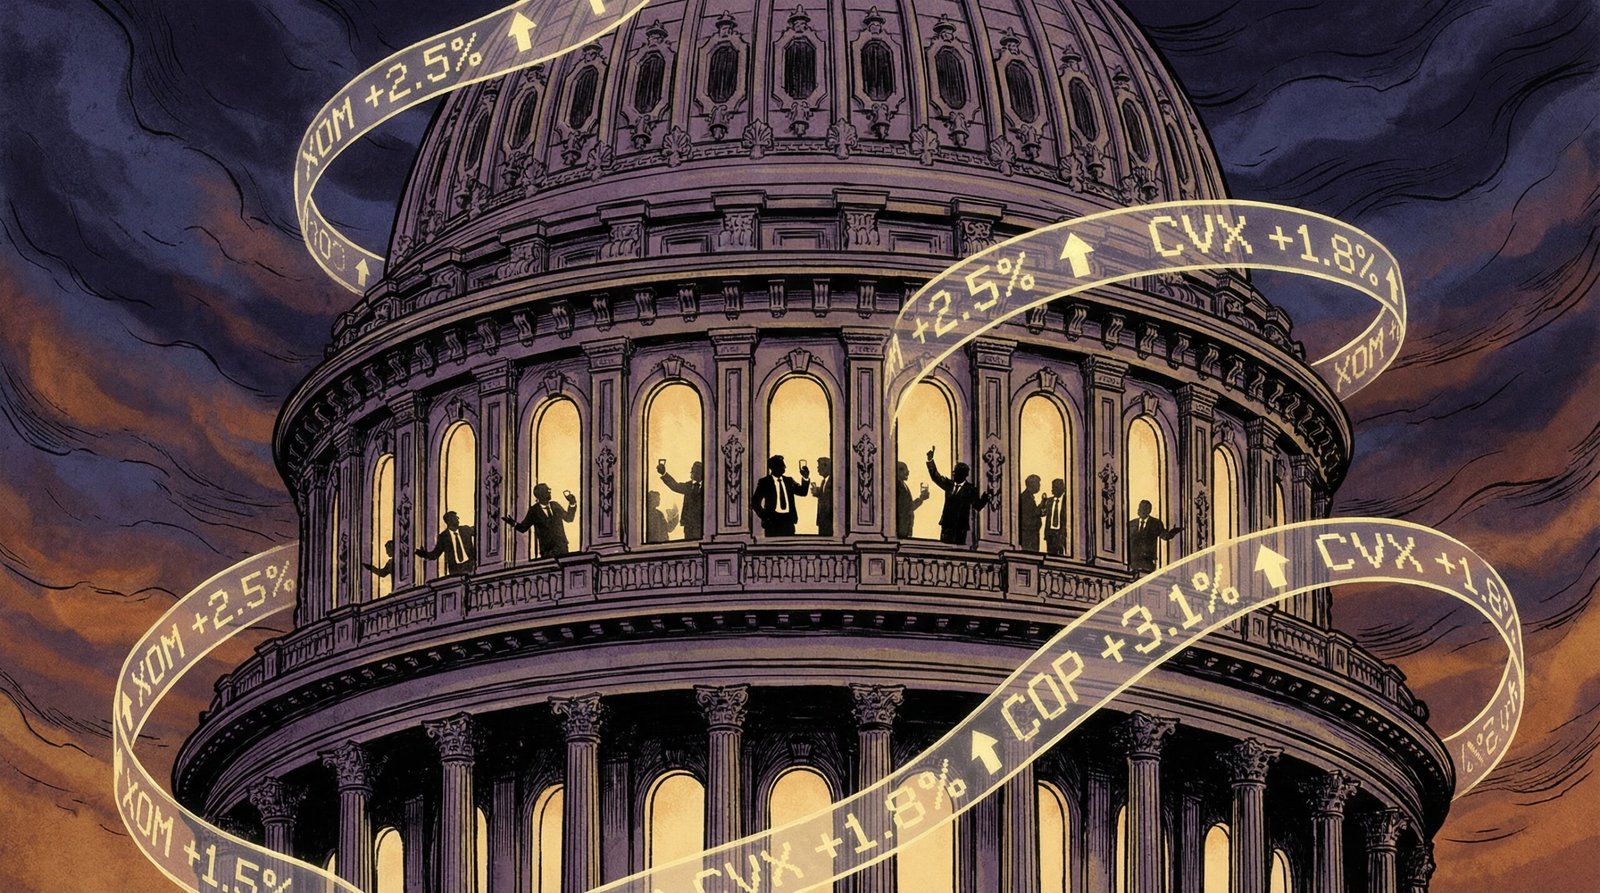
Congress Members Are Profiting Too — While Voting for the War
You’d think there would be a law against this. There isn’t, really.
As Chevron, ExxonMobil, and ConocoPhillips stocks hit new highs in early March 2026, financial disclosures revealed that multiple members of Congress own shares in all three companies — the same week they were being briefed on war costs and supplemental funding requests. Finviz reported on the congressional holdings on March 2, as the oil majors posted new 52-week highs.
This is a structural feature of American governance, not a bug. The revolving door and weak disclosure rules mean the policymakers deciding war and energy strategy are also personally invested in the financial instruments that benefit from that strategy. The median age of the U.S. Senate is 65. The age group most likely to hold energy stocks is 55+. These populations overlap almost entirely.
There is no federal law prohibiting members of Congress from trading stocks in industries they directly regulate or companies affected by legislation they vote on, despite multiple failed reform efforts. The STOCK Act of 2012 imposed disclosure requirements but not trading restrictions. The ETHICS Act and various anti-corruption proposals have died in committee repeatedly — tabled, frequently, by the legislators most personally affected by the restrictions.
What Happens If Hormuz Closes? The $150 Barrel Scenario
Prices now are the mild version of this story. The catastrophic version has a name: full Strait of Hormuz closure.
The Strait of Hormuz is the world’s most critical oil chokepoint, through which approximately 20% of the world’s oil — roughly 20 million barrels per day — transits. Iran has repeatedly threatened to close it. The Kpler tanker tracking firm says it has reached “de facto closure” status through insurance withdrawal — ships can’t get coverage to transit, so they aren’t. The insurance market has effectively closed Hormuz even without a formal blockade.
If formal closure or sustained military interdiction materializes:
- Goldman Sachs projected $100/barrel “within days” at the current trajectory (from $90)
- Commerzbank analysts projected $130–$150/barrel under full Hormuz closure
- The 1973 Arab oil embargo quadrupled prices in four months; a Hormuz closure would be structurally larger
- At $150/barrel, U.S. regular unleaded reaches an estimated $5.50–$6.00/gallon nationally
- The Hormuz supply chain crisis extends beyond oil — LNG, petrochemicals, and fertilizer feedstocks all move through the strait
At $6/gallon, the energy burden math becomes brutal. For a low-income millennial spending 17.8% of income on energy today, a doubling of gas prices means an effective income cut of several thousand dollars per year. For an ExxonMobil shareholder holding 1,000 shares, a $150/barrel world means higher dividends and a higher stock price.
The gas prices Iran war 2026 trajectory is not a question of whether prices rise further — it’s a question of how much. The American energy independence myth always obscured this: even as the U.S. became the world’s top oil producer, domestic pump prices remain tied to global Brent pricing. There is no “American price” for oil. There is only the world price. And the world price just went to war.
Counter-Argument: “Everyone Benefits From Energy Security”
The standard rebuttal goes something like this: “Energy security protects everyone. Defeating Iran prevents worse disruptions. Higher oil prices hurt everyone equally. The market has no generational agenda.”
These arguments deserve engagement, not dismissal.
On energy security: It’s a legitimate concept. But “energy security” doesn’t explain why a 10-day bombing campaign — rather than the diplomatic strategy that had been producing Iranian moderation signals in late 2025 — was the chosen policy instrument. Energy security doesn’t require producing the precise kind of disruption (a Hormuz near-closure and a 27% crude spike) that maximizes short-term oil company profits while inflicting pain on energy-importing consumers. If the goal were energy security, you’d expect the administration to be managing prices down, not describing disruptions lasting “weeks, not months.”
On equal pain: High gas prices do not hit equally. The data is unambiguous: low-income households, younger workers, renters, and commuters bear disproportionate energy burden. This is not opinion — it’s the ACEEE’s energy burden research, the EIA’s income-share data, and the Federal Reserve’s wealth distribution tables. A retired boomer in Phoenix with $500,000 in XOM/CVX and an electric vehicle does not experience $3.41 gas the same way as a 32-year-old delivery driver in the same city with $4,300 in savings.
On market neutrality: Markets don’t have generational agendas. But the distribution of market outcomes does, because the distribution of asset ownership is itself the product of decades of policy choices — deregulation, the shift from pensions to 401ks, NIMBY housing policy, student debt expansion — that compressed younger cohorts’ ability to accumulate investable assets. The market is neutral. The conditions under which people enter the market are not.
FAQ
How high could oil prices go in the Iran war 2026?
Brent crude was at $92.69/barrel on March 7, 2026 — up 27% since the war began February 28. Goldman Sachs projected $100/barrel “within days.” Under a full Strait of Hormuz closure scenario, Commerzbank analysts estimate $130–$150/barrel. At $150/barrel, U.S. regular unleaded could reach $5.50–$6.00/gallon nationally.
Do boomers actually own more energy stocks than millennials?
Yes. The Motley Fool’s 2025 Generational Investing Trends Survey found 50% of baby boomers own energy/utility stocks vs. 34% of millennials and 30% of Gen Z. Americans over 55 own 73–75% of the entire U.S. stock market, up from 52% in 1992. Baby boomers alone control 53% of all corporate equities. Energy stocks like ExxonMobil and Chevron are standard boomer dividend portfolio holdings, marketed specifically to retirees seeking income stability.
How much do low-income Americans spend on energy?
According to the American Council for an Energy-Efficient Economy (ACEEE), low-income households spend an average of 17.8% of their total income on energy bills and transportation fuel — more than three times the national average. Approximately 1 in 7 American families live in “energy poverty” (14%+ energy burden). The Trump FY2026 budget proposed eliminating all $4 billion in LIHEAP funding, which helps approximately 6 million low-income households pay their energy bills.
What is the oil shock 2026 generational inequality impact on millennials specifically?
Millennials and Gen Z together hold just 10.5% of total U.S. wealth ($17.1 trillion) despite being the largest population cohort. Their financial exposure to oil is primarily as consumers of energy rather than owners of energy assets. Rising gas prices represent a direct income reduction for millennial renters and commuters. The war generating the oil shock is simultaneously being funded by federal debt that will be serviced by younger taxpayers — $6 billion in week one alone per Pentagon figures. The oil shock 2026 generational inequality dynamic is structural: older Americans own the assets that go up; younger Americans pay the bills that go up.
Sources & Methodology
Oil prices and energy sector performance: Brent crude and WTI prices from Reuters, Al Jazeera, CNBC, and the New York Times (March 1–7, 2026). S&P 500 Energy Sector return from S&P Global Dow Jones Indices (as of March 5, 2026). XLE ETF data from Robinhood and 247WallSt (March 7, 2026). February 2026 sector performance from market data cited by Threads/@coolmind.warmheart.
Generational stock ownership: The Motley Fool 2025 Generational Investing Trends Survey (energy/utility ownership by generation). American over-55 stock market share from Fortune/SmartAsset citing Federal Reserve data (73–75%, up from 52% in 1992). Boomer total wealth ($77 trillion, 51.1% of U.S. wealth) from MarketWatch/Morningstar citing Federal Reserve Distributional Financial Accounts (Feb. 28, 2026). Top 10% stock ownership (87–93%) from Seeking Alpha/Yahoo Finance citing Federal Reserve data. Millennials/Gen Z wealth share (10.5%, $17.1 trillion) from Visual Capitalist.
Energy burden and gas prices: Low-income energy burden (17.8% of income) from ACEEE, 2024. Energy poverty (1 in 7 families, 14% burden) from Rocky Mountain Institute. Gas prices: AAA (national average $3.25 on March 5; $3.32 on March 6; $3.41 on March 7). EIA projection (<2% of disposable income pre-war) from EIA press release, 2025. LIHEAP elimination from NEADA analysis of FY2026 White House budget.
War costs: Pentagon $6 billion first-week cost from Anadolu Agency citing New York Times reporting on Congressional briefings (March 8, 2026). Congressional energy stock holdings from Finviz (March 2, 2026).
Hormuz and price scenarios: 20% world oil supply figure from The Conversation and Kpler. Goldman Sachs $100/barrel projection from Reuters/Bloomberg reporting. Commerzbank $130–$150 scenario from Commerzbank Week in Focus (March 6, 2026). 1973 embargo pricing from Federal Reserve History essay.
Boomers Broke America covers systemic economic failures with a generational lens. All data is sourced from primary research institutions, federal agencies, and major wire services. We do not provide financial advice.