
Pharmacy benefit managers (PBMs) are the largely invisible intermediaries between drug manufacturers, insurance companies, and the pharmacies where Americans fill their prescriptions — and they have used that position to extract an estimated $116 billion annually from the U.S. drug supply chain through a combination of spread pricing, retroactive clawbacks, and vertical integration that has made the three largest PBMs — CVS Caremark, Express Scripts (Cigna), and OptumRx (UnitedHealth Group) — among the most profitable corporate entities in American history while simultaneously driving up the prescription costs paid by patients, employers, and taxpayers. The PBM racket is not a side effect of the American healthcare system. It is a load-bearing wall.
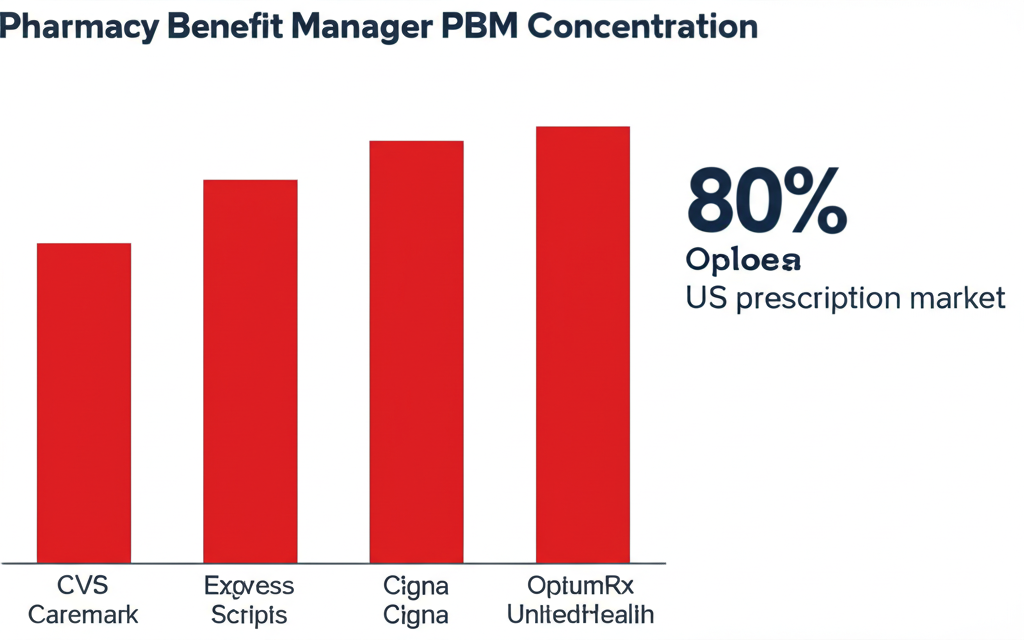
Key Takeaways: Three PBMs — CVS Caremark, Express Scripts, and OptumRx — control roughly 80% of all U.S. prescription claims. Through spread pricing, PBMs pocket the difference between what they charge insurers and what they reimburse pharmacies — a gap the FTC found averaged $9.30 per prescription on Medicaid managed care plans. Retroactive DIR fees clawed back $12.6 billion from pharmacies in 2023, up from under $1 billion in 2013. Independent pharmacies are closing at 300+ per year. Congress has passed partial reforms but has not touched the core extraction mechanism. The FTC investigation launched in 2022 produced a damning 2024 report — then stalled under new leadership.
What Is a Pharmacy Benefit Manager and Why Does It Exist?
The pharmacy benefit manager business model was invented in the 1960s as a genuine efficiency play. Insurance companies were processing individual prescription claims by hand. A third-party administrator that could handle claims processing, build pharmacy networks, and negotiate bulk discounts from drug manufacturers simultaneously made economic sense. For the first two decades of their existence, PBMs were relatively modest businesses doing moderately useful work.
Then three things happened that turned a claims-processing utility into a $116 billion extraction machine. First, Congress passed ERISA in 1974, which preempted state regulation of employer-sponsored health plans and created a federal regulatory vacuum that PBMs exploited for 50 years. Without meaningful state-level oversight, PBMs operated in near-total opacity. Neither the employers paying for drug coverage nor the patients using it had any idea what PBMs were charging versus paying.
Second, the managed care revolution of the 1980s and 1990s turned PBMs from plan administrators into active gatekeepers. The formulary — the list of covered drugs — became a lever of enormous financial power. Drug manufacturers began paying PBMs to place their products on favorable tiers. These payments were called “rebates,” a term that implies they flow back to payers. Many do not. According to a 2022 Senate Finance Committee investigation, the three largest PBMs retained approximately 30% of all rebates collected from drug manufacturers rather than passing them through to insurers or plan sponsors. In 2022, that represented roughly $7 billion in retained rebates on insulin alone.
Third — and most consequentially — PBMs merged with the insurers and pharmacy chains they were supposed to negotiate against. The result is vertical integration so complete that the same corporate parent now manages the drug benefit through its PBM, insures the patient through its health plan, and fills the prescription through its retail pharmacy chain. The conflict of interest is not incidental. It is the business model.
The Big Three: CVS Caremark, Express Scripts, and OptumRx
Understanding the PBM racket requires understanding who the three dominant players are. The high cost of prescription drugs in America cannot be understood without understanding that the entities supposedly negotiating lower prices are simultaneously the entities profiting from higher prices through spread pricing, retained rebates, and formulary manipulation.
CVS Caremark is the PBM subsidiary of CVS Health, which also owns Aetna (one of the nation’s largest health insurers) and CVS Pharmacy (9,000+ retail locations). CVS Health reported $357 billion in revenue in 2024. CVS Caremark manages approximately 34% of all U.S. prescription claims. The company that manages your drug benefit is the same company that owns your pharmacy and insures you. This is not disclosed in any consumer-facing materials.
Express Scripts is the PBM subsidiary of Cigna, which merged with it in 2018 for $67 billion in a vertical integration play. Cigna/Express Scripts manages roughly 25% of U.S. prescription claims and operates Accredo, the largest specialty pharmacy in the United States, controlling distribution of the highest-cost drugs — oncology, MS, rheumatoid arthritis — for a substantial fraction of commercially insured patients.
OptumRx is the PBM subsidiary of UnitedHealth Group — the largest health insurer in the U.S. with 2024 revenues of $400 billion. UnitedHealth also employs approximately 90,000 physicians through Optum Health, runs surgical centers, and owns Change Healthcare, the largest healthcare transaction clearinghouse in the country. OptumRx manages roughly 24% of U.S. prescription claims. Together, the Big Three control approximately 80% of the U.S. prescription market.
“Three corporations — CVS Health, Cigna, and UnitedHealth Group — now control approximately 80% of U.S. prescription claims through their PBM subsidiaries. Their combined 2024 revenues exceed $1 trillion. The FTC has described this concentration as ‘deeply troubling.’ No other country on earth has allowed healthcare intermediaries this degree of vertical monopoly power.”
How the PBM Racket Works: Spread Pricing, Clawbacks, and DIR Fees
The mechanics of the PBM racket operate through three primary extraction mechanisms, each deliberately designed to be opaque to the payers and patients being extracted from.
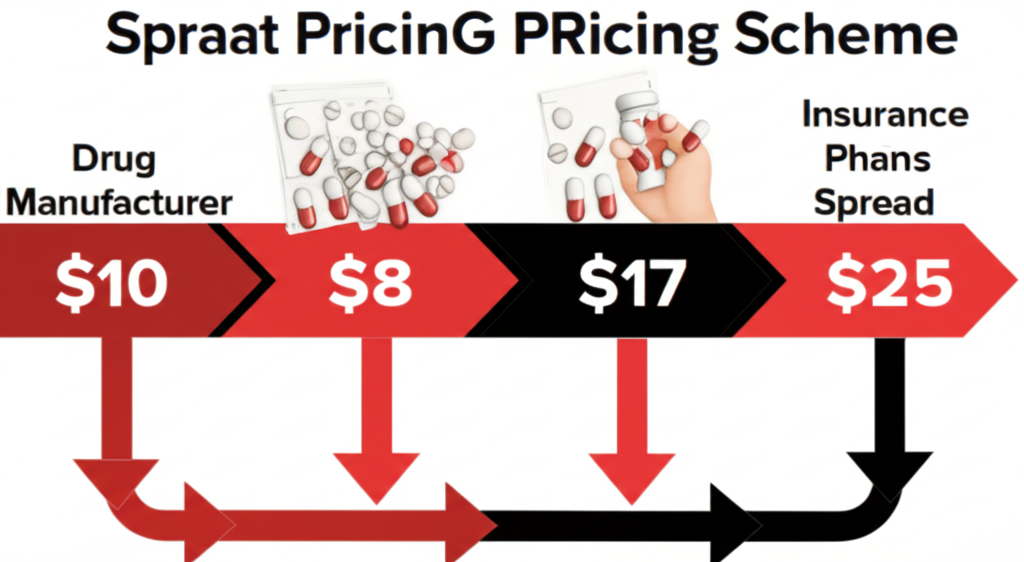
Spread pricing is the foundational scheme. A PBM contracts with an insurance plan at a negotiated rate — say, $25 for a generic blood pressure medication. The same PBM has separately contracted with the dispensing pharmacy to reimburse it $8 for that same medication. The PBM bills the plan $25, pays the pharmacy $8, and pockets the $17 “spread” without disclosing this to either party. A 2019 Ohio Medicaid audit found PBMs spread-priced Ohio Medicaid prescriptions by an average of $8.31 per prescription, generating $208 million in spread pricing revenue in a single year from one state’s program alone. The FTC’s 2022 study estimated $9.30 per prescription on Medicaid managed care nationally — approximately $2.8 billion annually extracted from public health programs.
DIR fees (Direct and Indirect Remuneration fees) are the mechanism by which PBMs claw back money from pharmacies retroactively, often months after a prescription has been filled. A pharmacy fills a prescription in January, records the reimbursement as revenue, then receives a DIR fee assessment in March that reduces its actual net reimbursement below the cost of the drug. The NCPA documented cases where DIR fee clawbacks pushed net reimbursement below pharmacy acquisition cost — pharmacies literally paying PBMs to fill prescriptions. Total DIR fees reached $12.6 billion in 2023, up from $9.1 billion in 2021 and less than $1 billion in 2013.
Rebate retention is the third pillar. Drug manufacturers pay PBMs to secure preferred formulary placement. The legal fiction is that rebates pass through to plan sponsors and patients. The Senate Finance Committee’s 2022 insulin investigation documented that PBMs retained approximately 30 cents of every rebate dollar on insulin. On $23 billion in annual insulin rebates, that produced roughly $7 billion in PBM insulin rebate revenue in 2022 alone — while insulin list prices kept rising and diabetic patients kept rationing doses.
Vertical Integration: The Scheme That Locked Out Competition
The pharmacy benefit manager industry’s most powerful entrenchment tool is vertical integration — the same strategy that private equity used to consolidate hospital systems and that telecom companies used to lock in regional monopolies. When a single corporate parent owns the insurer, the PBM, the pharmacy, and the specialty drug distributor, it can route prescriptions through its own entities at every step of the chain, capturing margin at each handoff regardless of whether that routing serves the patient.
The preferred pharmacy network is the primary self-routing tool. A PBM-designed network can set out-of-pocket costs higher at non-affiliated pharmacies, steering enrolled patients toward the affiliated retail chain. CVS Caremark, which manages benefits for Aetna members, has faced multiple state investigations and class action lawsuits alleging its network design steers Aetna members toward CVS Pharmacy locations, generating margin for the parent company at the expense of member choice.
Specialty pharmacy is where vertical integration reaches its most profitable expression. Specialty drugs account for approximately 55% of total drug spend despite representing only 2% of prescriptions. CVS Specialty, Cigna’s Accredo, and UnitedHealth’s Optum Specialty together control specialty distribution of the highest-cost drugs dispensed to commercially insured patients — drugs where PBM spread pricing can reach hundreds or thousands of dollars per prescription.
The result is a system with no functioning market. A plan sponsor that wants to audit whether its PBM is extracting spread pricing cannot do so because PBM contracts do not require disclosure of actual drug acquisition costs. The revolving door between PBM lobbying shops and congressional staff has ensured that legislative remedies proposed over two decades have been watered down or killed in committee. Meanwhile, the long-term care insurance crisis and the nursing home staffing collapse compound the same underlying dynamic: financialization of healthcare that extracts from patients rather than serving them.
How PBMs Are Killing Independent Pharmacies
The most direct human consequence of the PBM racket is the accelerating closure of independent community pharmacies. Independent pharmacies are closing at 300+ per year, according to the NCPA. In rural and low-income urban areas, they are often the only pharmacy within reasonable distance, the only provider willing to compound medications, and the only pharmacist who knows patients by name and catches dangerous drug interactions that chain pharmacies, operating on volume metrics, miss.
PBMs are killing these pharmacies through below-cost reimbursements combined with retroactive clawbacks. The NCPA’s 2023 Digest found the average independent pharmacy received reimbursements below its actual drug acquisition cost on 13% of claims in 2022, up from 9% in 2020. On branded drugs, that figure reached 22%. Pharmacies are filling prescriptions at a loss while PBMs simultaneously pocket spread and claw back DIR fees that further reduce net reimbursement below zero.
“Independent pharmacies are closing at 300+ per year. PBM reimbursements fell below drug acquisition cost on 13% of all independent pharmacy claims in 2022 — rising to 22% on branded drugs. In rural communities, losing the local pharmacy means losing the only healthcare provider within driving distance.” — National Community Pharmacists Association, 2023 Digest
The pharmacy desert problem this creates is not abstract. A 2023 University of Pittsburgh study found 23% of low-income urban census tracts and 35% of rural census tracts qualify as pharmacy deserts. They cluster in Black and Hispanic communities and in high-Medicaid areas. Patients in pharmacy deserts are 1.3x more likely to be non-adherent to chronic medication regimens for hypertension, diabetes, heart failure, and HIV — directly associated with increased hospitalizations. The medical debt crisis that already accounts for the largest share of American personal bankruptcies is in part downstream of these PBM-created access barriers driving preventable hospitalizations.
What Congress Has Done and Failed to Do About PBMs
The legislative history of PBM reform is a masterclass in how industry lobbying produces decades of studied inaction punctuated by cosmetic reforms that leave the core extraction mechanism intact. The FTC formally opened a PBM investigation in June 2022, culminating in a 73-page interim staff report in July 2024 that described PBM practices as potentially “harmful” to competition and patients. FTC Chair Lina Khan called the practices “a key driver of the prescription drug cost crisis.” Following the 2024 election, new FTC leadership publicly deprioritized large-company antitrust enforcement in healthcare. The PBM investigation has been functionally paused as of early 2026.
Congress passed two relevant measures. The Inflation Reduction Act of 2022 capped Medicare Part D out-of-pocket costs at $2,000 starting in 2025. The Lower Costs, More Transparency Act (2023 omnibus) requires PBMs to report spread pricing annually to employer plan sponsors, prohibits gag clauses that prevented pharmacists from telling patients when cash prices were cheaper than insurance copays, and eliminates retroactive DIR fees for Medicare Part D starting in 2024. The DIR fee elimination is estimated to save pharmacies approximately $8 billion annually in clawback exposure. The gag clause prohibition has produced documented cost savings for patients on select generic medications.
What Congress has NOT done: required disclosure of actual drug acquisition costs; mandated full rebate pass-through; prohibited PBM ownership of specialty pharmacies receiving preferential routing; or extended DIR fee elimination beyond Medicare Part D to commercial insurance markets. The Medicare system and the Medicaid system are now formally documented victims of PBM spread pricing. The commercial insurance market, which covers the majority of Americans under 65, has received essentially no reform at all.

The Counter-Argument: Do PBMs Actually Lower Drug Costs?
The PBM industry’s primary defense is that without PBMs, drug prices would be even higher. The Pharmaceutical Care Management Association (PCMA) argues PBMs saved the U.S. healthcare system $1.4 trillion over 10 years through rebate negotiations and formulary management. This figure deserves scrutiny.
The $1.4 trillion calculation is a projection, not an audit. It compares actual drug spending against a hypothetical counterfactual constructed by PCMA — the organization whose financial interest lies in producing the largest possible savings number. Independent economists and the FTC have been unable to replicate the calculation because PBMs do not disclose underlying data. There is a version of the PBM argument that is genuinely defensible: bulk purchasing creates leverage individual plan sponsors lack, generic substitution programs have demonstrably reduced some drug costs, and formulary tiering does incentivize manufacturers to lower list prices for preferred placement.
The problem is not that PBMs do none of these things. The problem is that the savings they generate for plan sponsors are structurally less than the margins they extract through spread pricing, retained rebates, and affiliated pharmacy steering. The FTC’s 2024 interim report concluded that Big Three specialty pharmacy affiliates charged significantly higher prices than independent competitors for the same drugs — meaning PBM vertical integration is actively raising costs in the highest-spend segment of the market. The net verdict: PBMs may have once served a cost-containment function. They have since evolved into an extraction mechanism that benefits their corporate parents at the expense of employers, public programs, and patients they nominally serve.
Frequently Asked Questions About PBMs
What is spread pricing and is it legal?
Spread pricing is the practice of charging a health plan more for a drug than the PBM pays the dispensing pharmacy, and keeping the difference. It is currently legal in commercial insurance markets in most states because PBM contracts do not require disclosure of the spread. Several states including Ohio, New York, and Arkansas have banned spread pricing in Medicaid managed care contracts following audit findings of systematic overcharging. No federal law currently prohibits spread pricing in commercial insurance markets.
Why don’t employers just switch to a different PBM?
Switching PBMs is difficult for several structural reasons. PBM contracts are typically multi-year, include termination penalties, and are written with information asymmetry that makes auditing impossible. Most large employers use benefit brokers to manage PBM relationships — and many brokers receive compensation from PBMs for steering clients, a conflict documented in a 2023 Senate Finance Committee report. The alternative PBMs that do not practice spread pricing have significantly smaller pharmacy networks and negotiating leverage than the Big Three.
How does this affect my prescription costs directly?
The most direct impact is formulary placement. If a manufacturer’s drug is on a favorable tier because that manufacturer paid higher PBM rebates, you pay lower copays. If a clinically equivalent or superior drug is on a higher tier because its manufacturer paid smaller rebates, you pay more — not because your medication is more expensive, but because PBM rebate economics favor a competitor. The gag clause elimination now allows pharmacists to tell you when paying cash is cheaper than your insurance copay. Ask at every prescription fill.
What happened to the FTC PBM investigation?
The FTC launched a formal PBM investigation in June 2022 and issued a 73-page interim report in July 2024 under Chair Lina Khan, describing practices as potentially anticompetitive and calling for further enforcement action. Following the November 2024 election, new FTC leadership publicly deprioritized large-company antitrust enforcement in healthcare. The PBM investigation has been functionally paused as of early 2026. Congressional PBM reform legislation introduced in the 118th and 119th Congress has not advanced to a floor vote.
Sources and Methodology
Data drawn from: FTC Pharmacy Benefit Managers Interim Staff Report (July 2024); Senate Finance Committee “Insulin: Examining the Factors Driving the Rising Cost” (2022); Senate Finance Committee “PBM Middlemen” report (2023); Ohio Office of Budget and Management Medicaid PBM audit (2019); National Community Pharmacists Association Annual Digest (2023); CMS Medicare Part D DIR Fee Data (2023); University of Pittsburgh pharmacy desert study, JAMA Health Forum (2023); JAMA Pharmacists Association medication adherence pharmacy desert study (2022); CVS Health, Cigna, and UnitedHealth Group 2024 annual reports; NCPA 2023 independent pharmacy closure rate data; FTC administrative complaint against PBMs (pending December 2024); PCMA 10-year savings projections (2023, methodology limitations noted).


