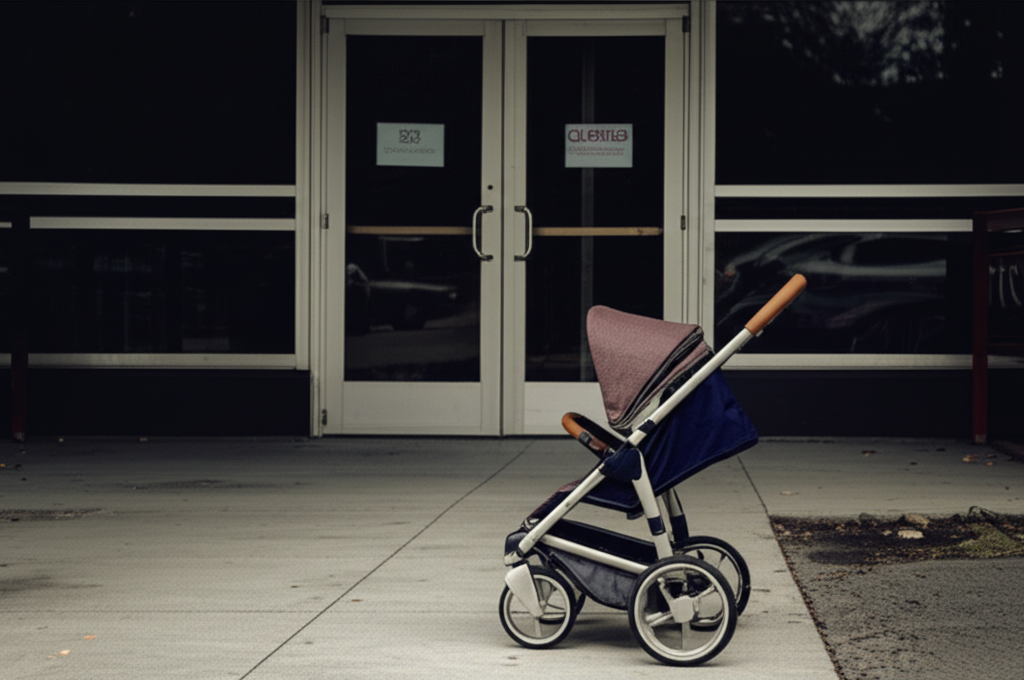
Childcare in America now costs more than college tuition in most states — and the reason isn’t a mystery. Eight of the eleven largest daycare chains in the country are owned by private equity firms. The workers earn a median $15.41 an hour. The parents pay up to $44,000 a year. The executives collect millions. The gap between what families pay and what workers earn isn’t an accident: it’s the business model.
Table of Contents
The childcare cost crisis didn’t happen by accident — it was engineered over decades of policy failure, deliberate public disinvestment, and a private equity takeover of an industry that once operated primarily as nonprofits. For Millennials and Gen Z already crushed by unaffordable housing, student debt, and war-driven stagflation, the childcare bill is now the deciding factor in whether to have kids at all. One in four Millennials and Gen Z say they won’t have children due to cost. That’s not a lifestyle preference — it’s an economic verdict.
Key Takeaways
• National average full-time daycare cost: $17,264/year per infant — more than in-state college tuition in most states
• 263% increase in childcare costs from 1990 to 2024; up 8% since June 2024 alone — double general inflation
• 8 of 11 largest daycare chains owned by private equity; PE firms extracting 15–20% profit margins
• KinderCare CEO: $2M compensation; childcare worker median: $15.41/hr ($40,890/year)
• 51% of Americans live in a “childcare desert” — no licensed capacity for children under 5
• $24 billion ARPA stabilization funding expired September 2024 — 70,000+ childcare slots eliminated
• 1 in 4 Millennials/Gen Z say they won’t have children due to cost; birth rate at historic lows
What Childcare Actually Costs in 2026
The numbers are almost embarrassing to print. The national average for full-time center-based daycare is $332 per week — roughly $17,264 per year for one child, according to Care.com’s 2026 Cost of Care Report. In Washington, DC, average infant care runs $24,243 annually. At Bright Horizons locations in Seattle? Up to $44,000 a year — more than the average American’s total income after taxes in many states.
Nanny care averages $870 per week (up 5% from 2024), or $45,240 annually for full-time coverage. The cheapest licensed option in the cheapest state still runs $8,684 a year. The U.S. Department of Labor calculates that American families spend between 8.9% and 16% of their median household income on care for just one child.
Since 1990, childcare costs have risen 263%, according to a KPMG analysis — roughly double the rate of general inflation. Since June 2024 alone, childcare prices have risen 8%, double the headline CPI rate. The New York Times reported in March 2026 that infant care was $8,632 per year at the low end of its sample — and that figure represents 10.4% of the median state family income. That’s more than families spend on food in most of America.
Here’s what makes the number especially absurd: the workers providing this care earn a median $15.41 per hour — or about $40,890 per year. A center charging $44,000 a year per child, often with 6–8 kids per classroom, is pulling in $264,000–$352,000 in tuition from one room. The teachers in that room share a combined salary that barely covers a third of that. The wage gap is structural — and entirely intentional.

Private Equity Owns Your Daycare Now
Childcare was once dominated by nonprofit community centers, church programs, and family home daycares. That era is over. Eight of the eleven largest daycare companies in the United States are now owned by private equity firms.
The playbook is identical to what private equity did to hospitals: acquire fragmented local providers, consolidate, cut labor costs, maximize enrollment, extract fees, and either go public or flip the company to the next fund. KinderCare — the largest private childcare provider in America, serving nearly 200,000 children — went public in 2024 after years of PE ownership. It generated $2.5 billion in revenue and $102.6 million in net income in its most recent fiscal year. CEO Tom Wyatt takes home nearly $2 million annually, plus equity compensation.
Bright Horizons — the second-largest chain — issued a $400 million stock buyback in 2021 while parents were paying $44,000 a year per child. In 2025, Bright Horizons signed fourteen new Fortune 500 employer contracts, expanding its employer-sponsored care model — which means large corporations can access subsidized care for their employees while independent families pay full freight.
PE ownership produces specific, predictable outcomes: centers run at maximum enrollment (often beyond safe staffing ratios), labor costs are minimized, and market consolidation eliminates the competition that would otherwise check prices. Jacobin documented in 2025 that PE-owned daycares systematically turn away families — not because they lack physical space, but because they lack the staff to maintain state-mandated ratios while keeping margins at 15–20%. The solution isn’t to hire more workers. It’s to stay at capacity and collect waitlist fees.
The Congressional Research Service documented the PE-to-IPO pipeline explicitly in 2024: KinderCare and Bright Horizons are case studies in how private equity firms “received returns and enhanced value” by owning infrastructure that parents have no choice but to use.
51% of Americans Live in a Childcare Desert
The supply problem is as severe as the price problem. A “childcare desert” is defined as a census tract with more than 50 children under age 5 but fewer than one licensed spot for every three of those children. By that definition, 51% of all Americans live in one, according to the Center for American Progress.
This isn’t a rural-only phenomenon. Urban and suburban childcare deserts are widespread, created by zoning restrictions, prohibitive licensing costs for small providers, and — critically — the PE consolidation model that closes marginally profitable smaller centers when it acquires them. When a local nonprofit daycare operating on thin margins gets absorbed into a regional chain that subsequently raises prices, the resulting unaffordability effectively creates a new desert: the building is still there, but most of the neighborhood’s families can’t afford it.
The consequences compound across the economy. Fortune reported in late 2025 that families are “just giving up” — sacrificing careers, savings, and income because the cost of childcare exceeds what a second income would cover. The American Progress analysis found that each year out of the workforce costs a family significantly more than three times the departing parent’s annual salary in lifetime income, compounded pension contributions, and Social Security credits. The childcare bill is actually a career-destruction bill disguised as a tuition invoice.
The $24 Billion Cliff Nobody Warned You About
During the COVID pandemic, Congress did something unusual: it treated childcare as infrastructure. The American Rescue Plan Act (ARPA) included $24 billion in childcare stabilization grants — funding that kept thousands of providers open, held prices down, and maintained capacity when supply chains and enrollment patterns were chaos.
Those funds expired in September 2024. Congress did not renew them. States tried to backstop the gap — and failed. The National Women’s Law Center documented the aftermath: providers who had used ARPA funds to raise worker pay, hire additional staff, and hold enrollment fees steady were suddenly facing the choice of cutting staff, raising prices, or closing. Many did all three in sequence.
The childcare sector lost an estimated 70,000+ slots in the 12 months following the ARPA cliff, according to advocacy group estimates. Waitlists at surviving centers exploded. And the price increases that followed — up 8% in a single year — reflected providers trying to cover costs that federal stabilization had previously absorbed.
This is the same policy pattern behind the ACA subsidy cliff and the SNAP cuts: temporary relief programs are allowed to expire, the underlying structural problems are never fixed, and the resulting pain lands squarely on the families least equipped to absorb it. The Boomer-era Congress that designed the original childcare policy landscape — no universal pre-K, no federal childcare guarantee, childcare treated as a private market good — ensured that any relief would be temporary and any crisis would be permanent.
The Generational Bomb: Why Millennials Are Just Not Having Kids
Nearly 1 in 4 Millennials and Gen Z say they won’t have children primarily due to financial cost, according to MassMutual research. That figure is not primarily about personal preference — it’s an economic calculation, and the math is clear: a dual-income Millennial household in a major metro area earning $100,000 combined faces a childcare bill that consumes 17–24% of gross income before taxes, housing, or student loan payments.
For lower-income households, the calculus is even more brutal. The Department of Labor found that families in the bottom income quintile spend an average of 35% of household income on childcare — for one child. That’s not a family making a choice; that’s a family choosing between childcare and rent.
The generational dimension is direct and deliberate. The Boomer political generation — which holds 51% of American wealth and dominated Congressional seats for three decades — was the last to benefit from a childcare landscape shaped by stay-at-home parents, affordable housing within commuting distance of work, and entry-level wages that could support a family. By the time Millennials entered childbearing years, every one of those structural supports had been stripped away, and no political consensus existed to replace them with public alternatives.
What exists instead: a tax code that allows the wealthy to deduct business expenses for household staff while the childcare tax credit caps at $3,000 — a number set in 2001 and never inflation-adjusted. The dependent care FSA, available through employers, maxes at $5,000. Neither begins to touch a $17,264 annual bill. The policy architecture was designed for a different economy, by a generation that never had to use it.
“The Market Will Fix It” — The Counterargument
The standard pushback: universal childcare is a government overreach, it creates dependency, the market will respond to demand by producing more supply, and competition will bring prices down.
This argument has been running for 40 years. Prices are up 263%. Childcare deserts cover half the country. The number of small independent providers has been declining for over a decade.
The market-failure diagnosis isn’t ideological — it’s empirical. Childcare is what economists call a “classic market failure”: high fixed costs, low margins, inelastic demand (parents can’t simply not work), and a labor force paid so little that turnover averages 30–40% annually. New entrants face regulatory barriers that favor scale (i.e., PE-owned chains). The economic conditions that would allow the market to self-correct don’t exist and cannot be created without the kind of policy intervention that the last 40 years of Boomer-led Congress explicitly refused to make.
The international comparison is damning. Denmark provides publicly funded childcare from age 6 months at a cost cap of roughly 25% of provider fees. Germany guarantees a childcare spot for every child over age 1 as a legal right. Both countries have higher birth rates than the United States and higher female labor force participation. The experiment has been run. The market didn’t fix it. Policy did.
FAQ
How much does daycare cost in America in 2026?
The national average for full-time center-based daycare is $332 per week, or approximately $17,264 per year per child, according to Care.com’s 2026 Cost of Care Report. Costs range from $8,684 to $44,616 annually depending on state, city, and type of care. In Washington, DC, average infant care runs $24,243 per year.
Why is childcare so expensive in the United States?
A combination of factors: minimal public investment (the U.S. has no universal childcare program), private equity consolidation that replaced nonprofits with profit-maximizing chains, $24 billion in federal stabilization funding that expired in 2024, zoning and licensing barriers that limit supply, and a structural market failure where prices are too high for parents but wages are too low for workers.
Who owns the biggest daycare chains in America?
8 of the 11 largest childcare companies are owned by private equity firms. KinderCare (nearly 200,000 children enrolled) and Bright Horizons are the two largest. KinderCare went public in 2024 after years of PE ownership; its CEO earns $2 million annually while median childcare workers earn $15.41/hour.
What is a childcare desert?
A childcare desert is a census tract with more than 50 children under age 5 but fewer than one licensed childcare slot per three children. 51% of all Americans currently live in a childcare desert, according to Center for American Progress data.
Sources & Methodology
Data sourced from: Care.com 2026 Cost of Care Report; Wonderschool 2026 Daycare Price Guide; Bureau of Labor Statistics — Childcare Workers OOH; U.S. Department of Labor — childcare cost/income data; New York Times Upshot — March 5, 2026; Jacobin — PE daycare model; Congressional Research Service — R48252, PE in childcare; National Women’s Law Center — ARPA cliff analysis; Center for American Progress — childcare deserts data; KPMG childcare inflation analysis via CNBC; MassMutual/CBSNews Millennial/Gen Z birth rate survey. All statistics reflect data available as of March 2026.