Voter suppression in America is not a conspiracy theory — it is a documented, data-rich consequence of two Supreme Court decisions that dismantled the core protections of the 1965 Voting Rights Act. Since the 2013 Shelby County v. Holder ruling gutted federal preclearance, formerly covered states have closed 1,688 polling places, enacted voter ID laws in 38 states affecting 21 million eligible citizens without qualifying documents, and eliminated or restricted mail voting access in ways that have disproportionately impacted Black, Latino, and Asian American voters. In 2025, state legislatures enacted 31 restrictive voting laws — the second-highest total since the Brennan Center began tracking this data — breaking a five-year trend of more expansive than restrictive legislation.
Key Takeaways
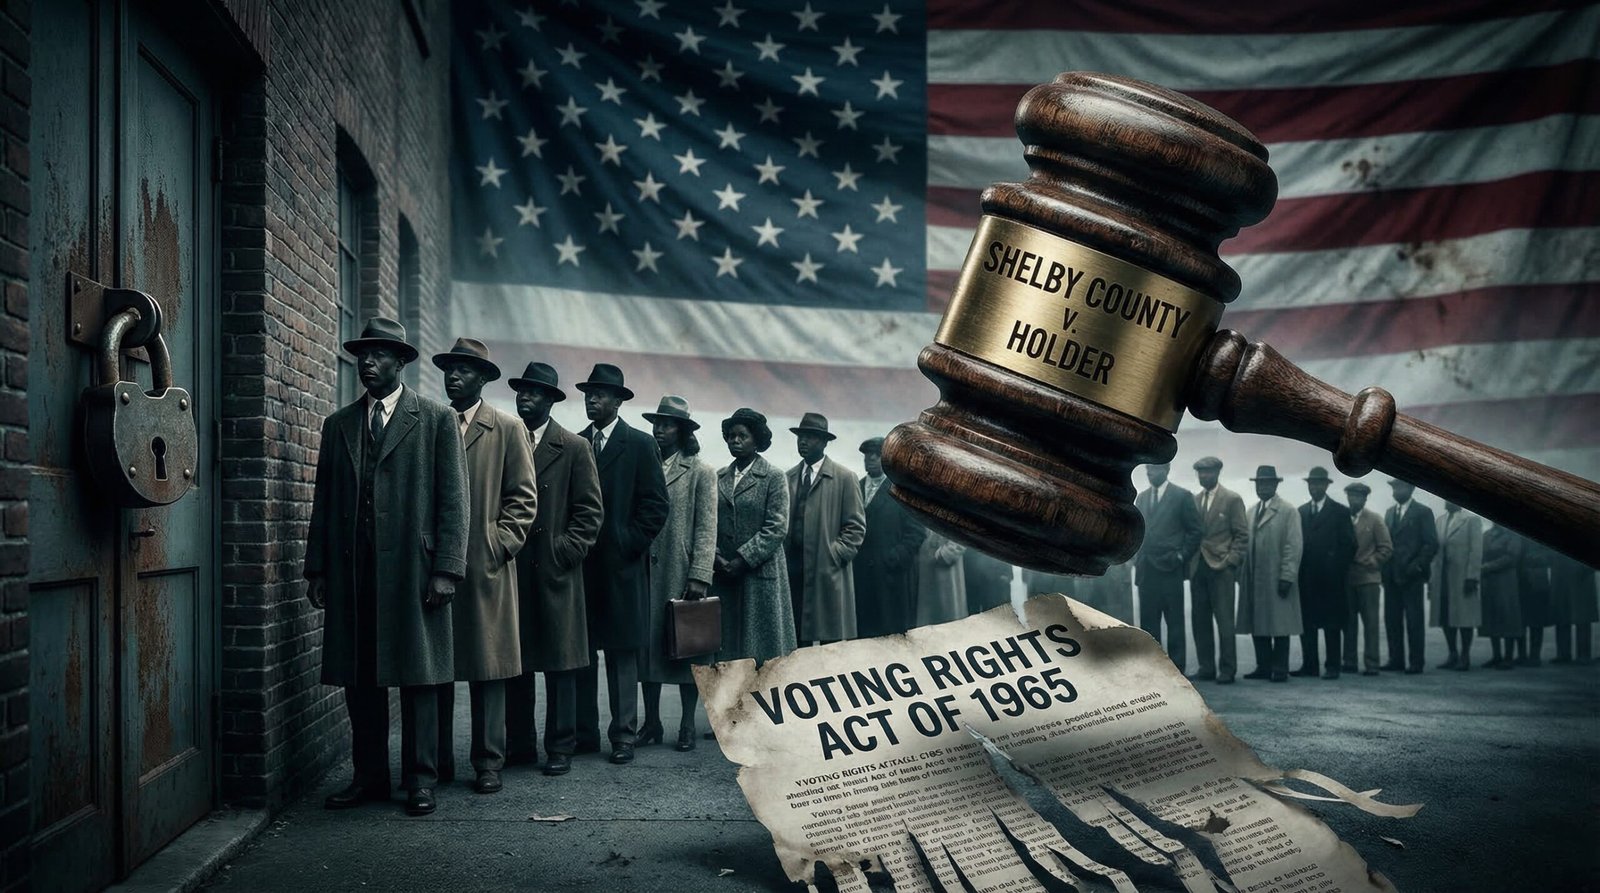
- The 2013 Shelby County v. Holder Supreme Court ruling struck down the preclearance formula of the Voting Rights Act, allowing formerly covered states to change voting laws without federal approval. Texas announced a voter ID law — previously blocked by preclearance — the same day the ruling came down.
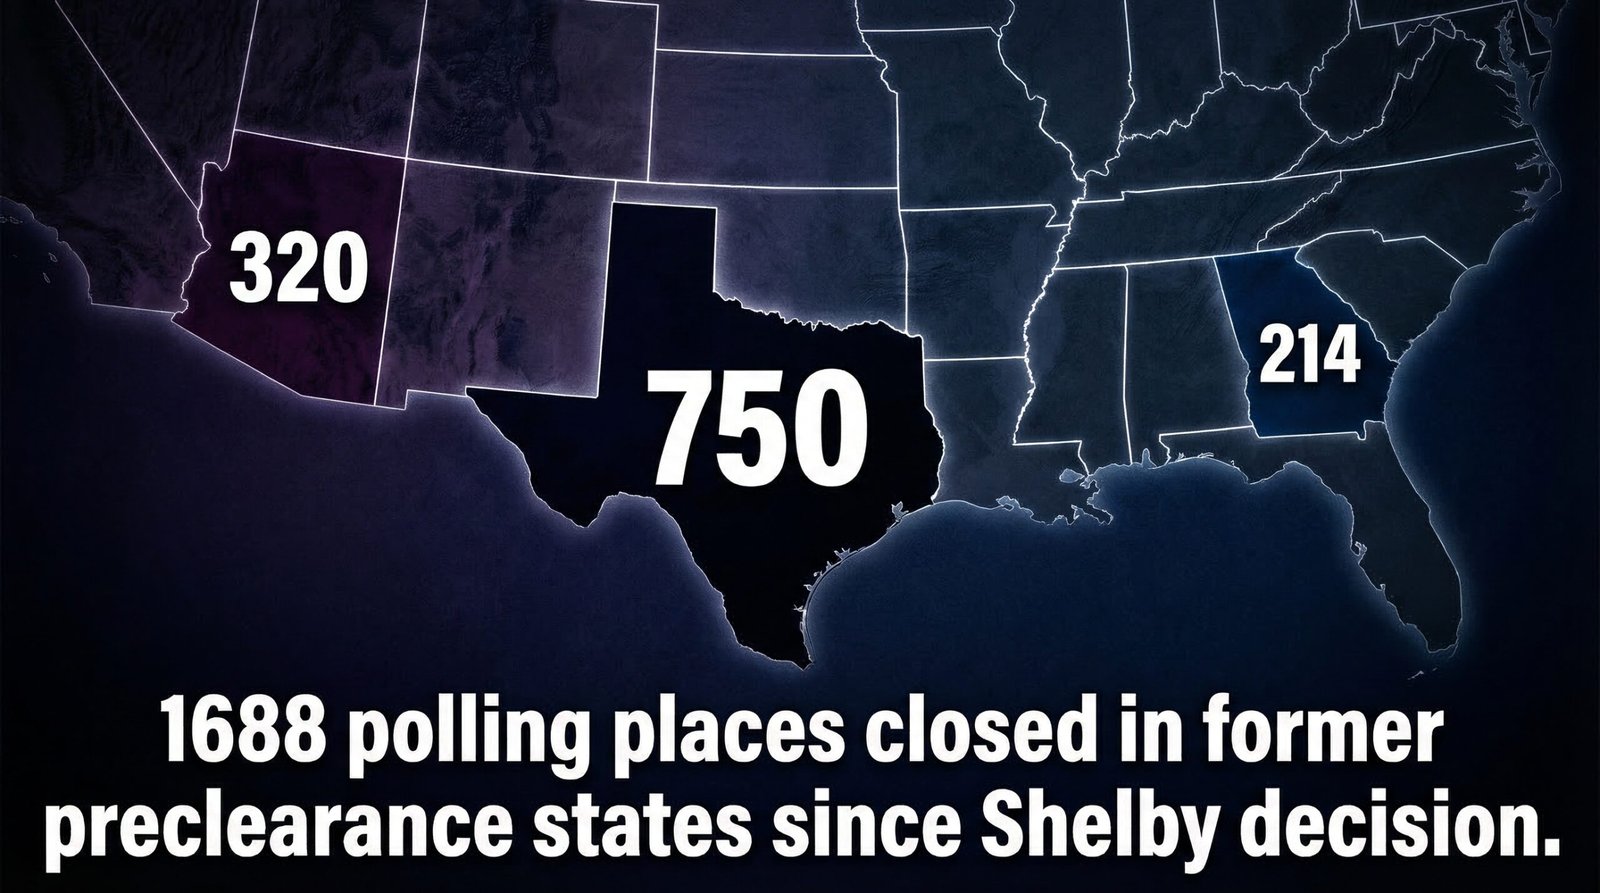
- Between 2012 and 2018, 1,688 polling places closed in formerly Section 5-covered jurisdictions. Texas alone closed 750; Arizona closed 320; Georgia closed 214.
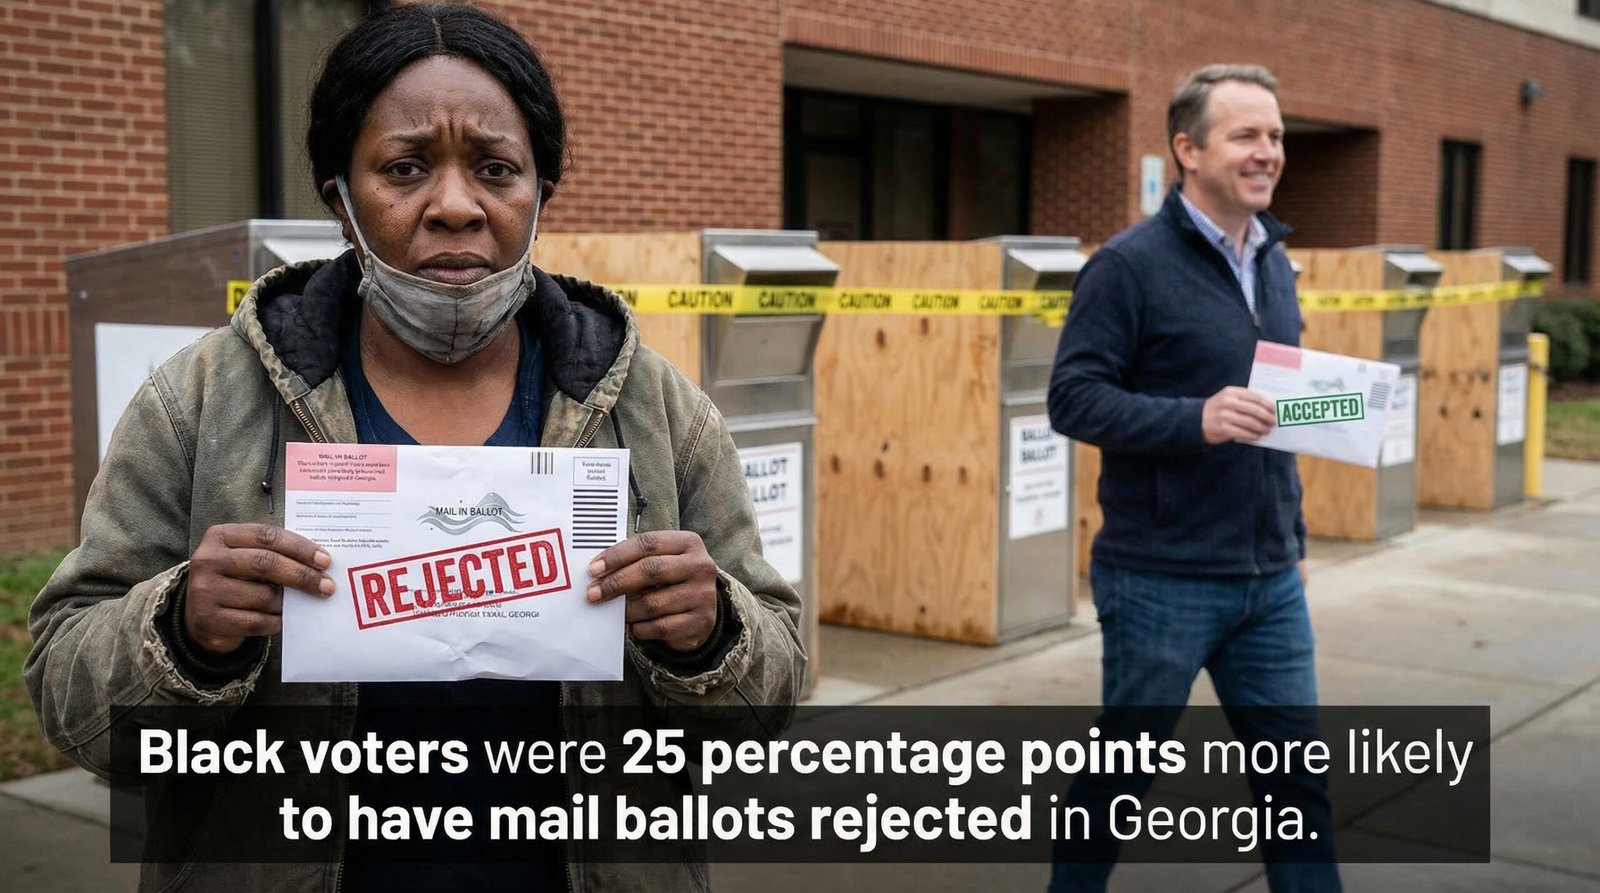
- Georgia’s SB 202 (2021) produced documented 2024 outcomes: Black mail voting collapsed from 29% in 2020 to 5% in 2024. Black voters were 25 percentage points more likely to have mail ballot applications rejected. Drop boxes fell 77% in Georgia’s most diverse counties.
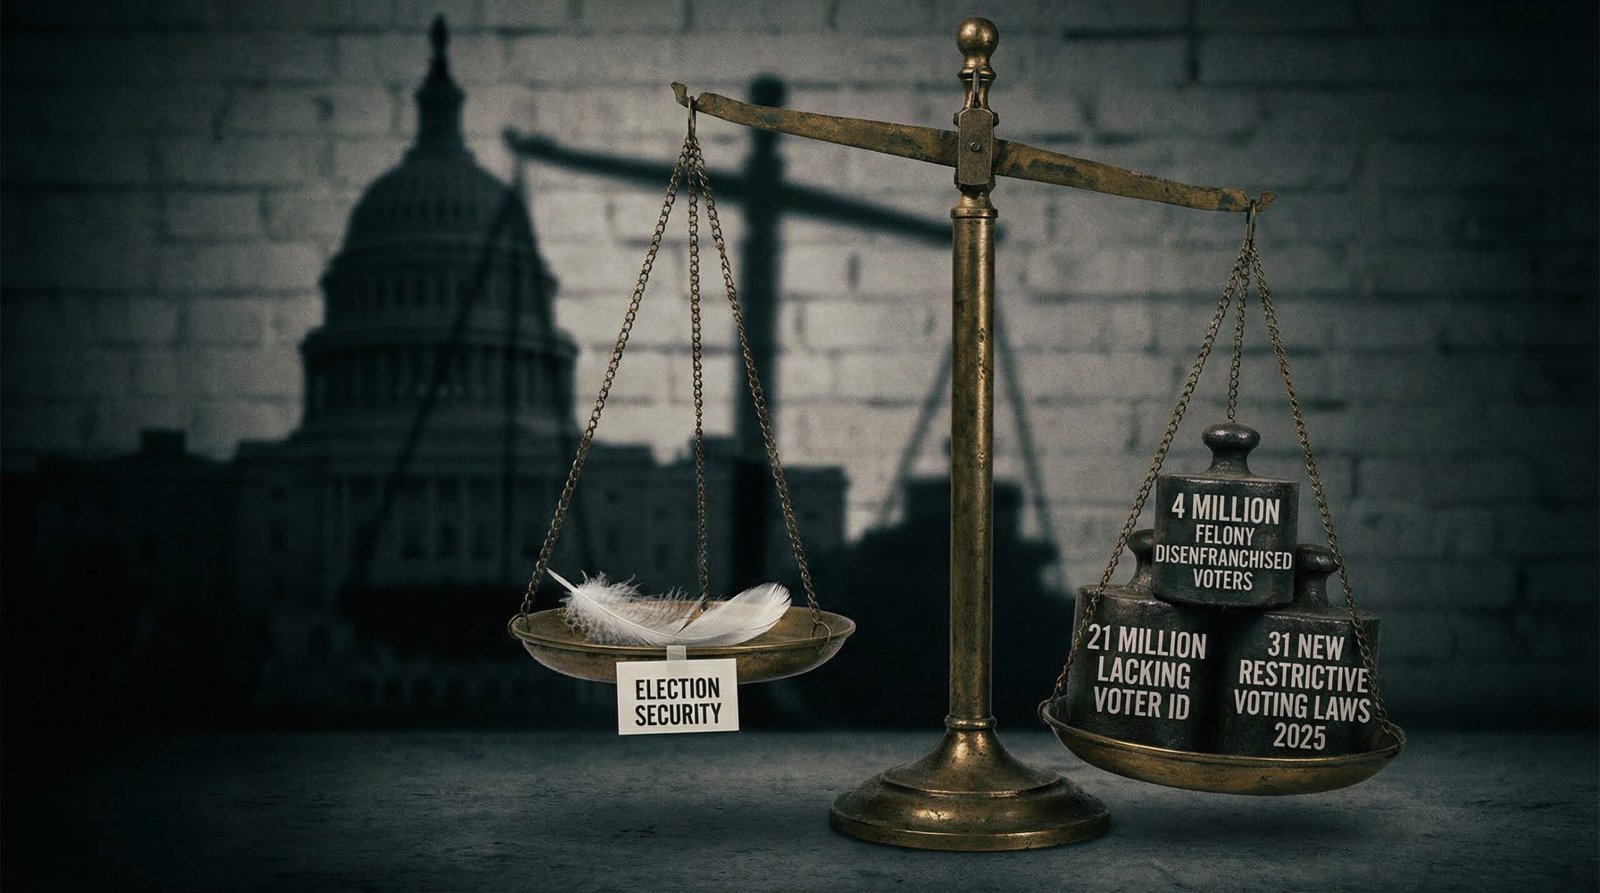
- 21.3 million Americans (9% of voting-age citizens) lack ready access to documents required under strict voter ID laws, according to the Brennan Center. Voter ID laws now exist in 38 states — more than ever before.
- 4 million Americans are unable to vote due to felony disenfranchisement laws (Sentencing Project, 2024). Black Americans are disenfranchised at more than four times the rate of non-Black Americans.
- The 2021 Brnovich v. DNC Supreme Court ruling gutted Section 2 of the VRA — the last major remaining protection — making racial discrimination in voting far harder to challenge in court.
- In 2025, state legislatures enacted 31 restrictive voting laws — the second-highest total on record — while expansive laws lagged for the first time in five years (Brennan Center).
What Happened to the Voting Rights Act?
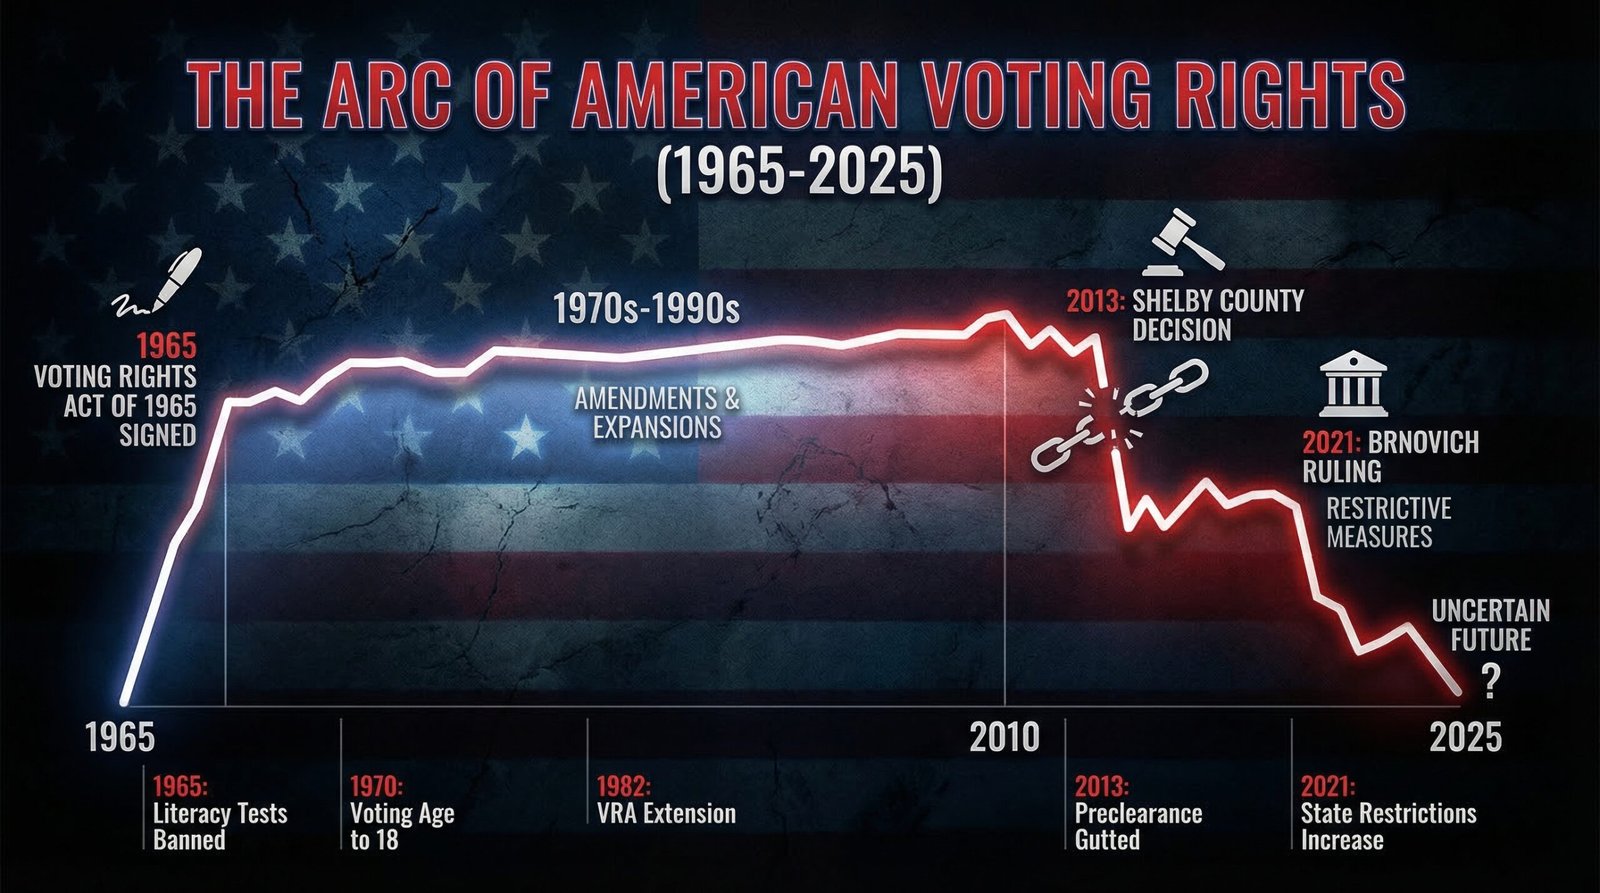
The Voting Rights Act of 1965 was the legislative response to systematic, violent exclusion of Black Americans from the ballot box. It contained two major enforcement mechanisms. Section 5 required that jurisdictions with documented histories of racial discrimination in voting — primarily Southern states and counties — obtain “preclearance” from the federal government before making any changes to voting laws or procedures. Section 2 provided a broader national prohibition on voting practices that resulted in racial discrimination, enforceable through federal lawsuits.
For nearly 50 years, preclearance worked. The Brennan Center documents that it blocked hundreds of discriminatory voting changes — voter ID laws, polling place consolidations, redistricting maps — before they could take effect. States under preclearance had to prove their changes wouldn’t harm minority voters, rather than forcing voters to prove harm after the fact.
On June 25, 2013, the Supreme Court’s 5-4 decision in Shelby County v. Holder struck down the preclearance formula in Section 4(b) — the mechanism that determined which jurisdictions were covered. Without that formula, Section 5 preclearance became unenforceable. Chief Justice Roberts wrote that “things have changed dramatically” in the South since 1965 and that the coverage formula was based on “decades-old data.” The four dissenting justices, led by Justice Ginsburg, warned that “throwing away your umbrella in a rainstorm because you are not getting wet” was the logic of the majority.
Texas announced implementation of its voter ID law — previously blocked under preclearance because federal reviewers found it would disproportionately burden Black and Latino voters — on the same day the ruling was issued. A federal court later found that law to have been enacted with discriminatory intent. That sequence — law blocked under preclearance, preclearance gutted, same law immediately enacted — is a useful illustration of what preclearance was protecting against.
Eight years later, Brnovich v. Democratic National Committee (2021) neutered what remained. The 6-3 decision raised the bar for Section 2 challenges, making it substantially harder to prove that facially neutral voting rules violated the VRA even when their impact fell disproportionately on voters of color. The Supreme Court’s decades-long project of dismantling the enforcement mechanisms built after the Civil Rights Movement reached its logical conclusion: the VRA exists on paper; its enforcement tools have been stripped down to near-uselessness.
The Polling Place Massacre: 1,688 Closures and Counting
The most direct form of voter suppression since 2013 is the simplest: close the polling places. No ID law required. No complicated paperwork. Just fewer locations to vote, longer lines, longer drives — and disproportionately in the counties that are most diverse.
Between 2012 and 2018, researchers documented 1,688 polling place closures across formerly Section 5-covered jurisdictions — the states that preclearance had specifically covered because of their documented history of racial discrimination. Key state totals:
- Texas: 750 polling places closed — the most of any state. Dallas County (41% Latino, 22% Black) eliminated 74 locations. Harris County (42% Latino, 19% Black) closed 52.
- Arizona: 320 fewer polling places. Maricopa County alone — 31% Latino — closed 171 polling places, more than the two next-largest closers in the state combined.
- Georgia: 214 fewer polling places. Some counties closed 80–89% of their voting sites. Georgia’s Secretary of State explicitly cited the Shelby decision as justification for encouraging county consolidations.
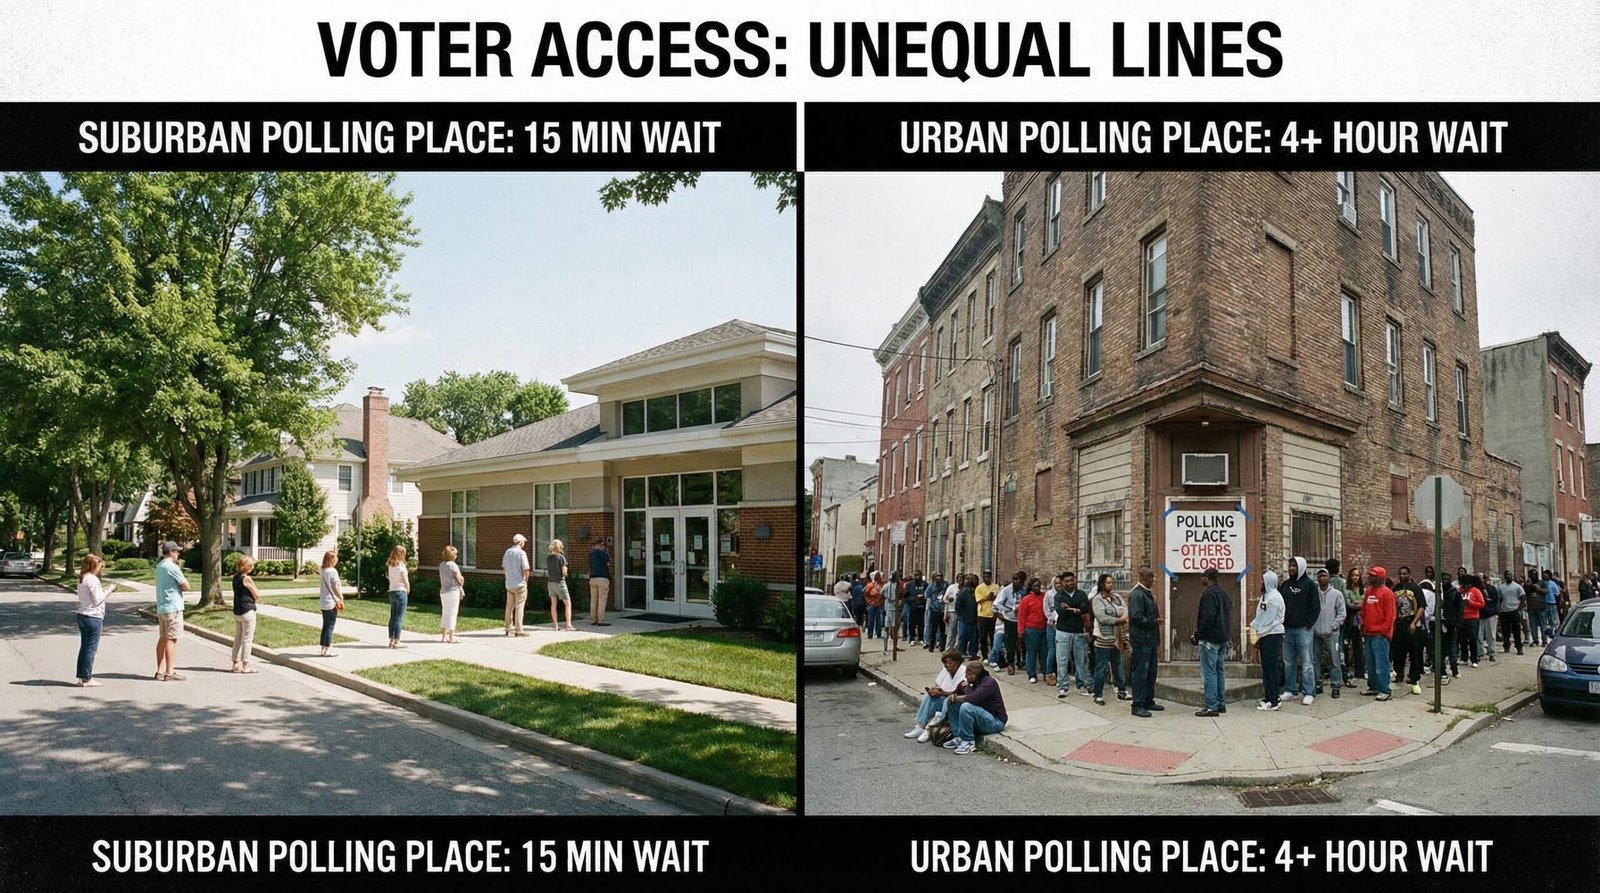
ABC News documented that 1 in 5 Election Day polling places in America have closed over the last decade — and the closures are not random. They are concentrated in counties with higher proportions of Black and Latino voters, lower median incomes, and lower rates of car ownership. Closing a polling place in a walkable urban neighborhood where residents rely on public transit has a fundamentally different impact than closing one in a suburban area where every household has two cars and the next polling place is a 10-minute drive.
The Leadership Conference on Civil and Human Rights documented the dynamic explicitly: the Shelby decision “catalyzed a systemic examination of poll closures and other seemingly innocuous changes that could have negatively impacted voters of color.” The word “innocuous” is doing a lot of work there. Closing 750 polling places in Texas after a Supreme Court ruling that eliminated federal oversight is not a coincidence. It is cause and effect with a 24-hour news cycle delay.
The connection to structural racial inequality built over decades is direct: the same zip codes that were redlined in the 1930s, denied GI Bill benefits in the 1940s, and gerrymandered in the 1990s are the ones losing polling places in the 2010s and 2020s. The mechanism changes; the result does not.
Georgia SB 202: The Most Documented Case of Voter Suppression in Modern America
Georgia’s Senate Bill 202, signed in March 2021, became the template for the wave of voting restrictions that followed. It came four months after Georgia voters turned out in record numbers for the 2020 presidential election and two Senate runoffs that flipped Democratic — making it one of the more transparently motivated pieces of legislation in modern American history. Four years later, federal court filings in 2024 produced the most granular dataset of documented voter suppression impacts in any recent election.
Mail voting collapse by race:
- Black mail voting: dropped from 29% in 2020 to 5% in 2024 — a 23-point collapse
- Asian American mail voting: fell from 40% to 7%
- Latino mail voting: dropped from 23% to 3%
- White voters experienced a 19-point decline, smaller in both absolute and percentage terms
Application rejection disparity: Black voters were 25 percentage points more likely than white voters to have mail ballot applications rejected under SB 202’s new rules. Nearly 130,000 Black voters lacked valid matching driver’s license IDs for mail voting, compared to 80,000 white voters — in a state where Black residents make up approximately 33% of the population.
Drop box elimination: In the 8 Georgia counties with the largest concentrations of Black, Asian, and Latino residents, drop boxes fell by 77%. Nearly three-quarters of Black voters lost access to a drop box in their home county, compared to half of white voters. Drop boxes had been expanded during the COVID-19 pandemic specifically to allow voters to cast ballots without physical contact at polling places. SB 202 restricted them to indoor locations during business hours only — effectively eliminating them as a practical option for working voters.
SB 202 also criminalized providing food or water to voters waiting in line — a provision that received widespread attention for its symbolic resonance, given that the longest lines were in majority-minority precincts created by those same polling place consolidations. Over 1.6 million registered Georgia voters faced increased barriers under the law, according to federal court filings.
The NAACP Legal Defense Fund challenged SB 202 in federal court. The case proceeded through the courts with those 2024 data points entered into evidence. The law remains in effect. This is what post-Brnovich Section 2 litigation looks like: years of litigation, documented harm in multiple election cycles, and no injunction.
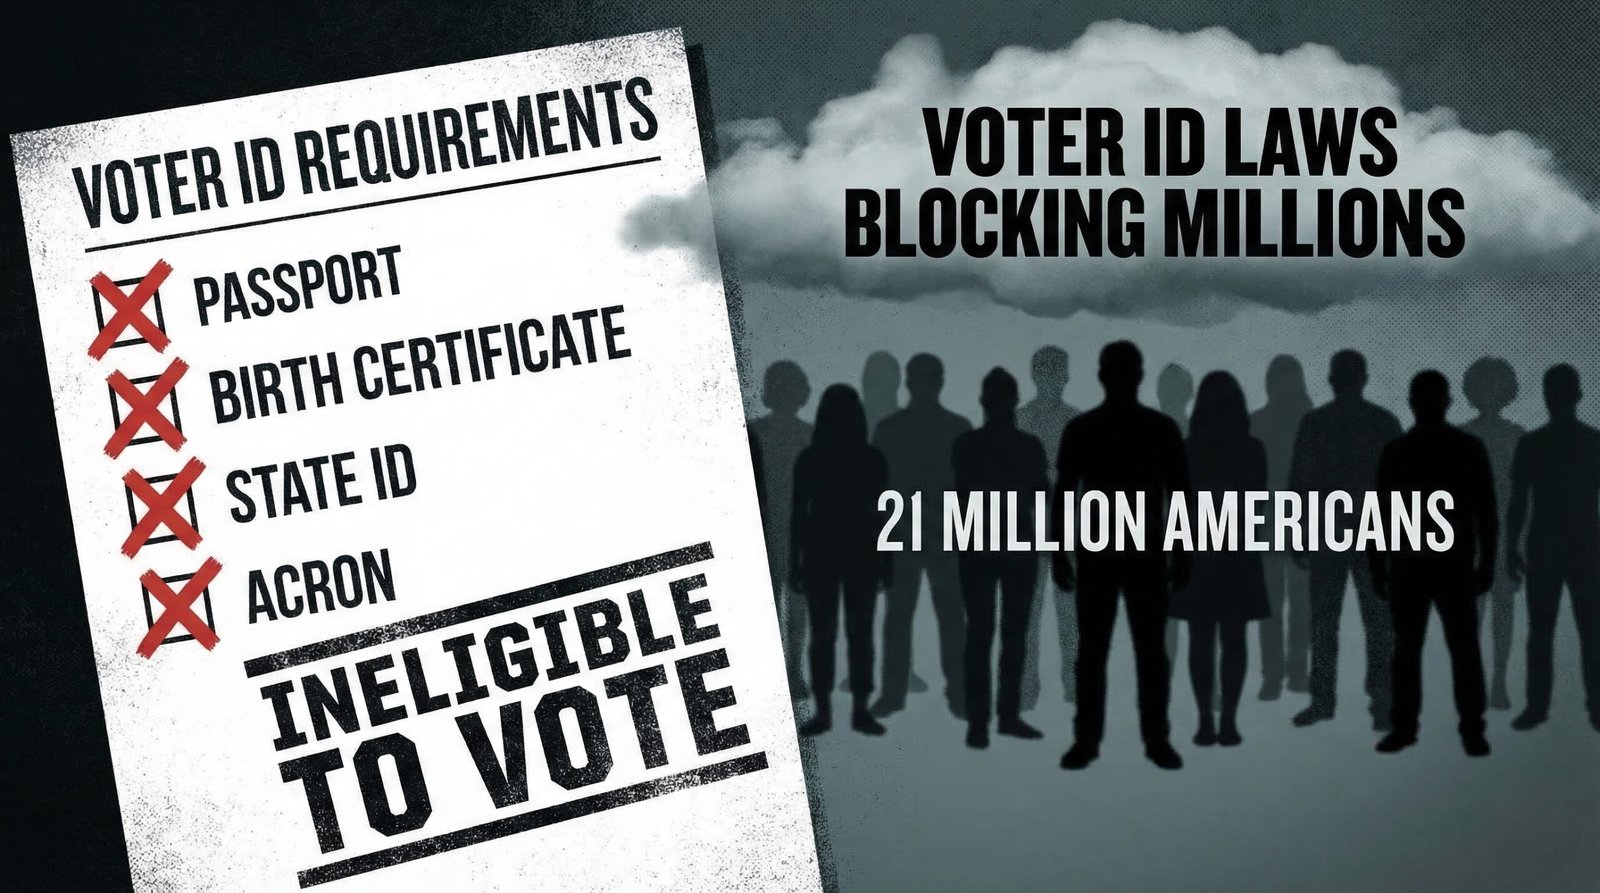
Voter ID Laws: 21 Million Americans Locked Out
Voter ID laws are the most politically popular form of voting restriction — and the one with the most documented gap between public perception and actual impact. As of 2024, 38 states have laws requesting or requiring voter ID — more than ever before in American history. Sixteen states have strict photo ID requirements, meaning voters without qualifying ID are turned away at the polls unless they cast a provisional ballot that may not be counted.
The Brennan Center’s research finds that 21.3 million Americans — 9% of voting-age citizens — lack ready access to the documents required under strict voter ID laws: no current passport, no recent birth certificate, no state-issued photo ID. That number is not evenly distributed:
- Elderly Americans, who may have birth records that predate standardized documentation, are disproportionately affected
- Low-income Americans who cannot easily take time off work to obtain documents at DMV offices are disproportionately affected
- Black and Hispanic Americans, who have lower rates of driver’s license ownership in some states, are disproportionately affected — the same populations that voter ID laws were flagged as burdening under the preclearance regime that no longer exists
- Young voters transitioning between states are disproportionately affected by registration and ID mismatches
Beyond voter ID, felony disenfranchisement laws blocked 4 million Americans from voting in the 2024 election, according to the Sentencing Project’s “Locked Out 2024” report. Given the documented racial disparities in the criminal justice system — connected directly to the mass incarceration policies of the Boomer era — Black Americans are disenfranchised at more than four times the rate of non-Black Americans. Florida alone has over 1 million disenfranchised citizens, the highest of any state.
The cumulative effect is a layered system of ballot access barriers that compound each other: polling place closures increase travel distance, strict voter ID laws require documentation many voters don’t have, mail voting restrictions remove the alternative, and felony disenfranchisement permanently removes millions from the rolls. Each barrier, presented individually, sounds like a minor administrative requirement. Together, they constitute a system that produces measurably different electoral access by race — which is exactly what preclearance was designed to prevent.
2025: The Worst Year for Voting Restrictions Since the 2013 Ruling
In 2025, state legislatures enacted at least 31 restrictive voting laws — the second-highest total since the Brennan Center began tracking this legislation, trailing only 2021’s post-January 6th wave. For the first time in five years, the number of restrictive laws exceeded expansive ones, breaking a trend that had briefly suggested the legislative tide was turning.
Among the notable 2025 changes: Utah — one of eight states that automatically mails ballots to all registered voters — enacted legislation requiring voters to opt in to receive mail ballots, reversing a system that had maximized participation. Other states tightened voter registration deadlines, added proof-of-citizenship requirements to voter registration (despite documented evidence that noncitizen voting is vanishingly rare), and restricted the use of student IDs as qualifying voter identification.
At the federal level, the SAVE Act — backed by Congressional Republicans in early 2026 — would require documentary proof of citizenship for voter registration in federal elections. Analysis by The Atlantic found the law would likely disenfranchise a significant number of eligible voters who lack birth certificates or passports, including — notably — rural and working-class whites who are a core Republican constituency. The bill’s primary practical effect, based on who lacks the required documents, would reach well beyond its stated target of noncitizen voting.
The Supreme Court added another dimension in 2025 when it agreed to hear Louisiana v. Callais, a case that legal analysts say could further gut Section 2 of the VRA by ruling that remedying racially discriminatory redistricting maps itself constitutes impermissible “racial gerrymandering.” If the Court rules that way, the last remaining enforcement lever of the Voting Rights Act would be effectively neutralized. The Alliance for Justice warned that this would leave minority voters “even more vulnerable to the very discrimination the Constitution was meant to prevent.”
The generational dimension of this issue is direct. The political class that designed these restrictions is disproportionately older, whiter, and more established in its electoral access. The voters who lack qualifying IDs, who rely on mail voting, who live in the precincts that lost polling places — they skew younger, lower-income, and less white. The system being dismantled was built specifically to prevent the enforcement of that advantage. Removing it reinstates it.
The Counter-Argument: Voter ID Prevents Fraud and Most Americans Support It
The mainstream argument for voter ID laws and related voting restrictions rests on two claims: (1) elections must be secure against fraud, and any reasonable measure to ensure that only eligible citizens vote is legitimate; and (2) strong majorities of Americans — including majorities of Black and Hispanic Americans — support voter ID requirements in polls.
Both claims have factual support. Documented in-person voter fraud is exceptionally rare — multiple studies, including a comprehensive review by the Heritage Foundation (which supports voter ID laws) found several hundred documented cases of in-person fraud out of billions of votes cast over two decades — but it does exist, and maintaining public confidence in election integrity is a legitimate governance interest. On public opinion: CNN polling has found 76% of Black Americans and over 80% of Americans overall support requiring a photo ID to vote. That is a genuine majority position, not a fringe view.
Where the argument is incomplete:
The fraud-prevention rationale and the voter ID policy do not match in scale. In-person voter fraud — the specific thing photo ID prevents — is documented at rates of a few hundred cases per decade in a country that casts 150 million votes in a presidential election. The burden of strict ID laws falls on 21 million Americans who lack qualifying documents. That is not a trade-off that survives scrutiny on its stated terms.
On public opinion: polling support for voter ID tends to measure the abstract concept of “showing ID to vote,” which most people find reasonable. The polling diverges when respondents are asked about specific implementations — strict photo ID with no alternatives, rejection of student IDs, no free ID provision, no same-day registration alternatives. Support drops significantly for the restrictive versions actually being enacted. The gap between “voter ID in principle” and “the specific voter ID laws being passed in 2024–2025” is where the polling headline and legislative reality diverge.
Finally, the polling place closure data does not fit any election security rationale. Reducing the number of polling places does not prevent fraud; it creates longer lines and higher barriers. The Shelby decision opened the door; the polling place closures walked through it. Those two facts are connected by the preclearance record, which shows that the jurisdictions that immediately began closing polling places after 2013 were precisely the ones that preclearance had previously prevented from doing so.
FAQ: Voter Suppression Statistics
What did Shelby County v. Holder do to voting rights?
The 2013 Supreme Court decision struck down the preclearance coverage formula in Section 4(b) of the Voting Rights Act, making Section 5 preclearance unenforceable. Preclearance had required nine states and numerous counties with documented histories of racial discrimination in voting to obtain federal approval before implementing any voting changes. Within hours of the ruling, Texas announced implementation of a voter ID law previously blocked by preclearance. Between 2012 and 2018, formerly covered jurisdictions closed 1,688 polling places.
How many polling places have closed since 2013?
At least 1,688 polling places closed in formerly Section 5-covered jurisdictions between 2012 and 2018, according to the Leadership Conference on Civil and Human Rights. Texas closed 750 (the most of any state); Arizona closed 320; Georgia closed 214. Separate research found that 1 in 5 Election Day polling places in the United States have closed over the past decade, with closures concentrated in counties with higher proportions of minority voters.
How many Americans are affected by voter ID laws?
The Brennan Center estimates 21.3 million Americans — approximately 9% of voting-age citizens — lack ready access to the qualifying documents required under strict voter ID laws (passport, birth certificate, or state-issued photo ID). An additional 4 million Americans are blocked from voting by felony disenfranchisement laws, according to the Sentencing Project’s 2024 report. As of 2024, voter ID laws of some form exist in 38 states — more than any point in U.S. history.
What did Georgia SB 202 do to Black voter turnout?
Federal court filings in 2024 documented that Georgia SB 202 (2021) produced a collapse in mail voting among minority voters: Black mail voting fell from 29% in 2020 to 5% in 2024 (a 23-point drop); Asian American mail voting fell from 40% to 7%; Latino mail voting dropped from 23% to 3%. Black voters were 25 percentage points more likely than white voters to have mail ballot applications rejected. In Georgia’s most diverse counties, drop boxes declined by 77%, and nearly three-quarters of Black voters lost access to a drop box in their home county.
Sources & Methodology
Primary sources: Brennan Center for Justice: Effects of Shelby County v. Holder on the Voting Rights Act; Leadership Conference on Civil and Human Rights: Democracy Diverted — Polling Place Closures and the Right to Vote (1,688 closure data); Democracy Docket: Georgia’s Sweeping Anti-Voting Law Suppressed Black Votes — New Data (2024); VoteRiders / Brennan Center: Voter ID Laws Impact Millions (2024); The Sentencing Project: Locked Out 2024 — Four Million Denied Voting Rights; Brennan Center: State Voting Laws Roundup — 2025 in Review (31 restrictive laws); Brennan Center: Section 2 of the Voting Rights Act at the Supreme Court (Louisiana v. Callais); ABC News: 1 in 5 Election Day polling places closed over last decade; The Atlantic: Trump’s Favorite Voter-ID Bill Would Probably Backfire (SAVE Act analysis); Alliance for Justice: Supreme Court Ready to Gut Last Vestige of Voting Rights Act; Voting Rights Lab: 10 Years Since Shelby County v. Holder. Supreme Court decisions: Shelby County v. Holder, 570 U.S. 529 (2013); Brnovich v. Democratic National Committee, 594 U.S. 647 (2021).