Breaking News


Popular News


Enter your email address below and subscribe to our newsletter

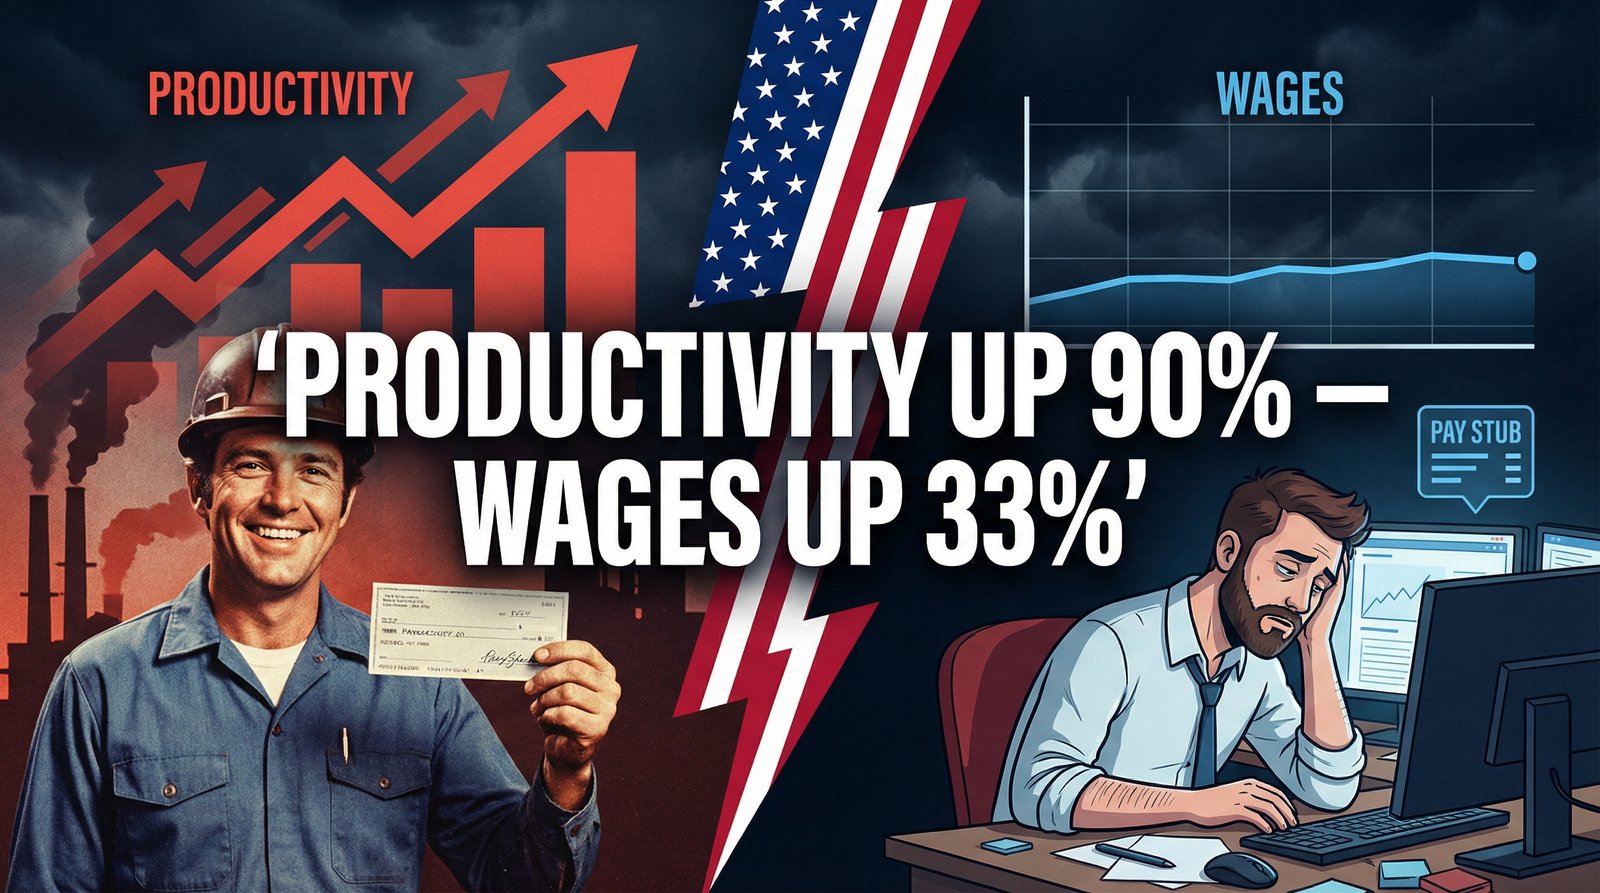
American workers are 90% more productive than they were in 1979 — and their paychecks show almost none of it. Here's exactly how the productivity-pay gap was built, who built it, and where all that money actually went.
American workers are 90% more productive than they were in 1979 — and their paychecks show almost none of it. According to the Economic Policy Institute’s January 2026 data, wage stagnation has created a gap where productivity grew 90.2% since 1979 while hourly pay grew just 33% — and for typical workers, real wage growth since 1973 has been barely above zero. The money was made. Someone got it. It just wasn’t you.
Key Takeaways:
• Since 1979, U.S. productivity grew 90.2% — typical worker pay grew 33% (EPI, Jan 2026)
• Between 1973 and 2013, hourly compensation for a typical worker rose just 9% while productivity rose 74%
• Union membership in the private sector collapsed from 34% (1973) to under 8% today for men
• CEO-to-worker pay ratio: roughly 20:1 in 1965 — now over 300:1
• The “benefits included” counter-argument falls apart: healthcare costs alone have swallowed any compensation gains
• The gap isn’t a natural market outcome — it’s the result of specific, deliberate policy choices made starting in the late 1970s
Productivity is a measure of how much economic output workers generate per hour. For most of American economic history, the working theory — backed by actual data — was that when workers produced more, they got paid more. Companies got more efficient. Workers shared in the gains. That was the deal.
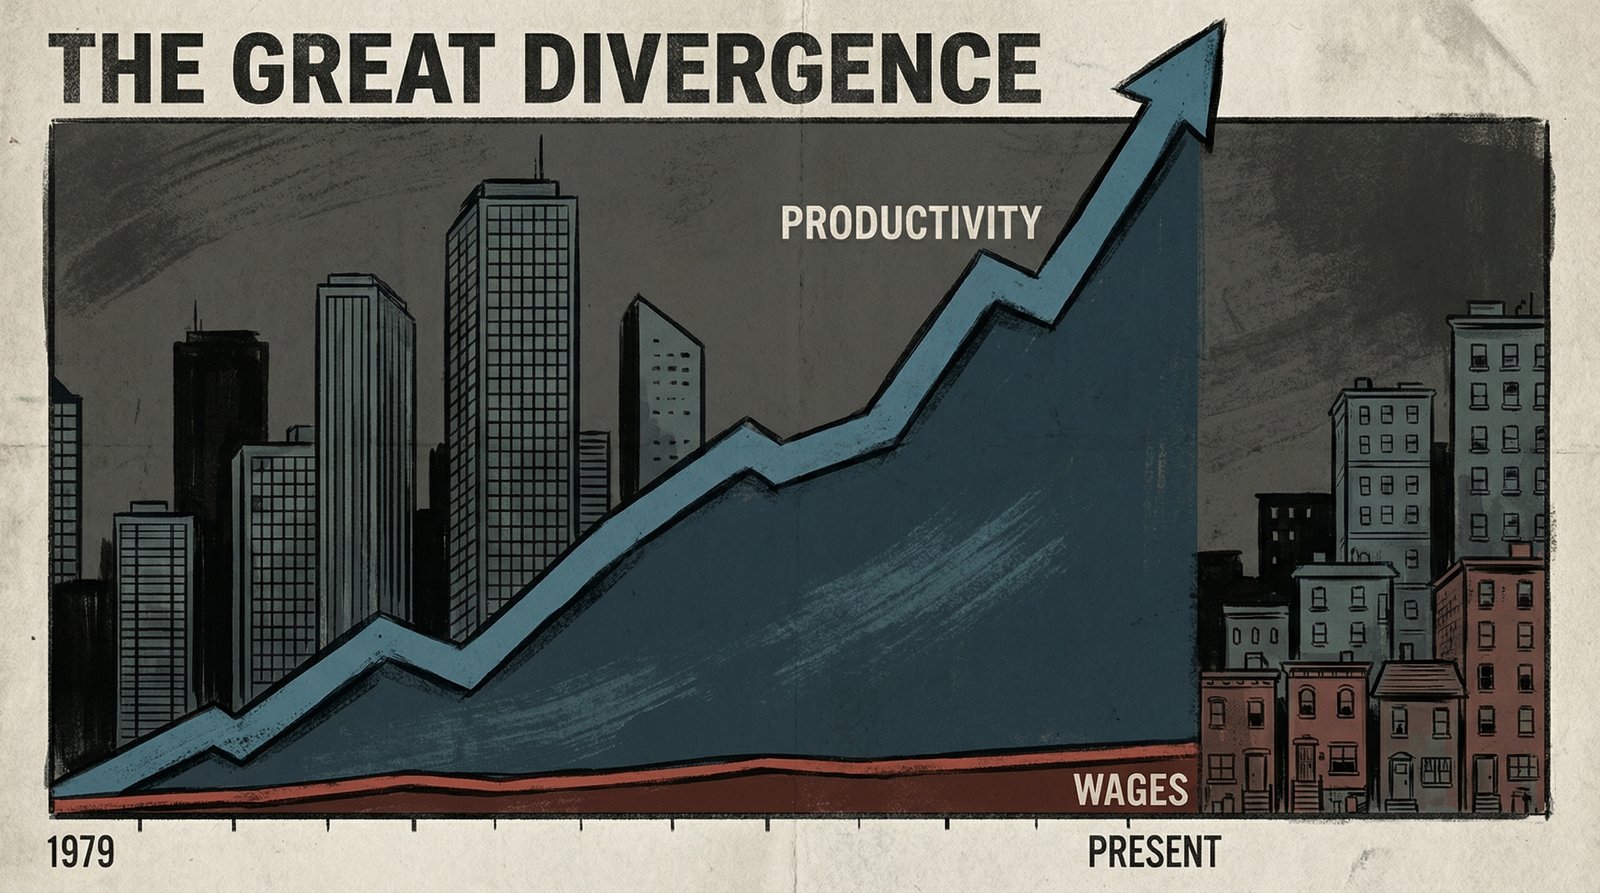
The productivity-pay gap is what happens when that deal gets torn up. According to the Economic Policy Institute, between 1979 and the third quarter of 2025, productivity grew 90.2%. Hourly compensation for a typical worker? 33.0%. In the 40 years between 1973 and 2013, it was even starker: productivity up 74%, typical worker pay up just 9%.
Do the math: roughly $60 of productivity gains for every $10 that made it into a typical worker’s paycheck. The rest? It went somewhere. We’ll get to that.
This isn’t a statistical quirk or a measurement debate. The divergence shows up in federal data, academic research, and across every income bracket below the very top. It shows up in rent that outpaces inflation, in college tuition that tripled in real terms, and in a generation of workers who are, by any productivity metric, doing more than their parents did — and building less wealth doing it.
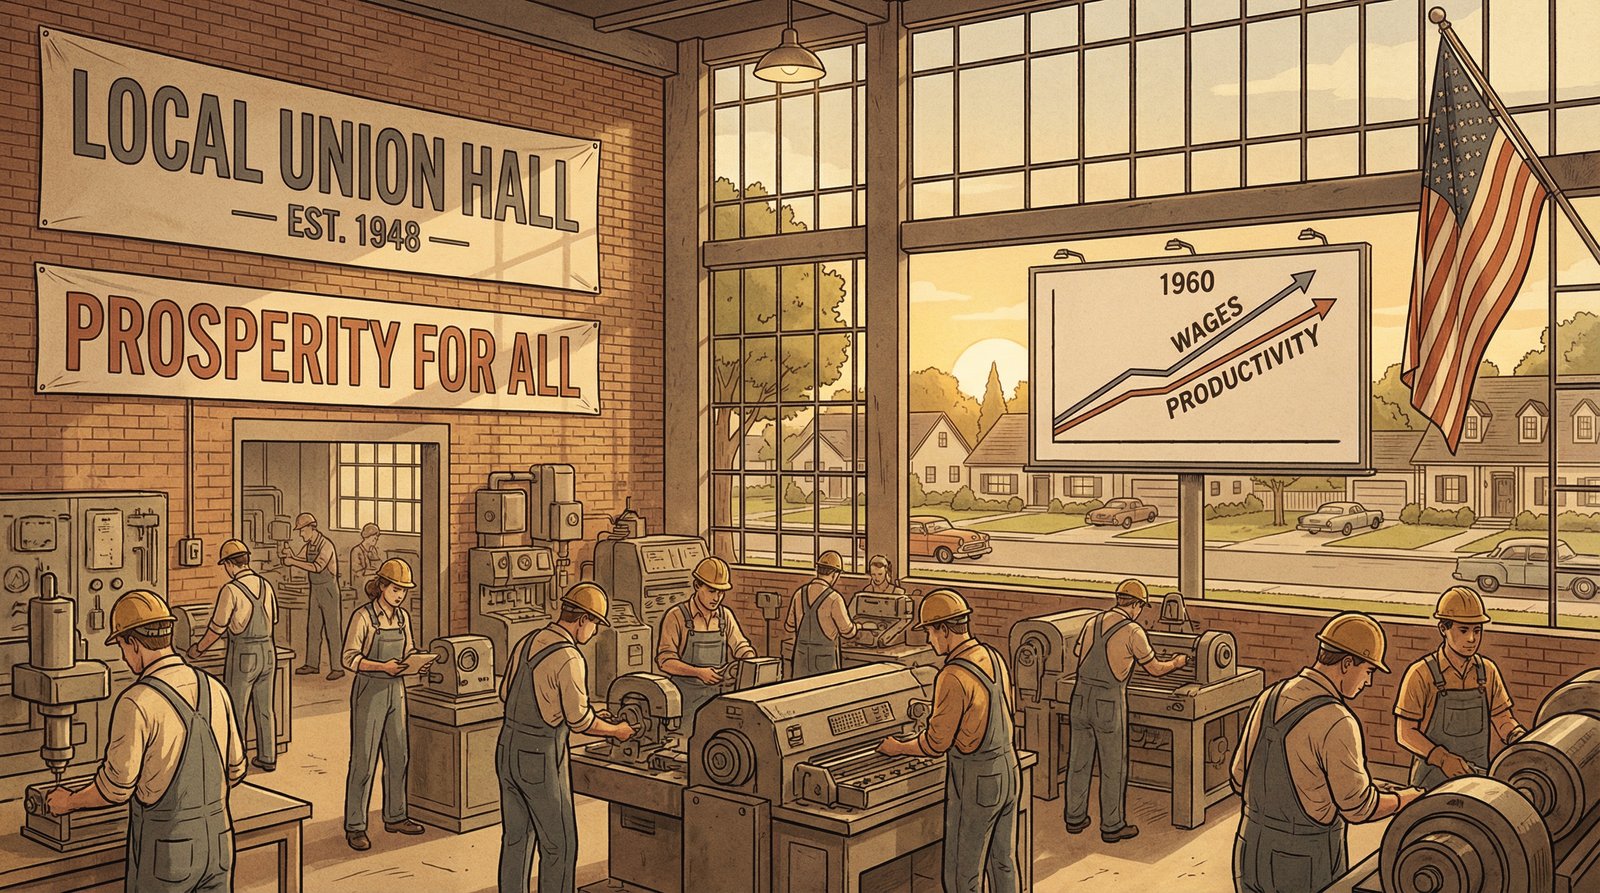
The post-World War II era was, by the numbers, an economic anomaly. From 1948 to 1979, productivity grew at an average of 2.5% annually. Hourly compensation grew at 2.1% annually. The lines tracked each other almost exactly. A rising tide genuinely lifted all boats — or close enough that most workers felt it.
This wasn’t magic. It was policy. Union membership was high — over a third of the private sector workforce in many industries. The minimum wage kept pace with inflation. Tax policy at the top was aggressive enough that hoarding all productivity gains at the executive level made less financial sense. And the labor market was tight enough that workers had leverage.
A single-income household in 1965 could afford a house, a car, healthcare, college for the kids, and a pension at the end. Not because Americans were uniquely virtuous or talented — because the system was structured to distribute productivity gains broadly. That structure was not permanent. And it was not accidentally dismantled.

Economic historians point to 1973–1974 as the inflection point. Oil shocks, the end of the Bretton Woods currency system, rising inflation — the macro environment got complicated. But the macro environment doesn’t fully explain what happened next, because inflation eventually subsided and productivity kept climbing. The wages didn’t follow.
What actually happened was a political and policy shift that accelerated through the late 1970s and exploded under Reagan in the 1980s. According to the EPI’s analysis, the productivity-pay gap widened due to a specific set of choices:
The result? An economy that kept growing — it just stopped sharing. From 1979 to 2020, workers’ wages grew 17.5% while productivity grew 61.8%. The bottom 90% of earners saw annual wages grow just 44% between 1979 and 2023 — roughly 0.6% per year compounded. Meanwhile, top-1% incomes soared.

The single most empirically documented driver of wage stagnation is the collapse of union membership. Between 1973 and 2007, private sector union membership fell from 34% to 8% for men and from 16% to 6% for women, according to research published in the American Sociological Review. Union membership isn’t just about wages for union members — it sets the wage floor for an entire sector. When the union rate falls, so does everyone’s leverage.
The numbers are stark. Between 1980 and 1984 alone, organized labor lost 2.7 million members among employed wage and salary workers — the sharpest four-year decline in modern history. Academic research estimates that declining unionization explains 10–20% of the growth in wage inequality among men from the late 1970s through the late 1980s alone.
What replaced union contracts? 401(k)s replaced pensions. Contract work replaced full-time employment. Gig arrangements replaced benefits. Each transition transferred risk from employer to worker — and each transfer showed up in the productivity-pay gap as another point of divergence. The modern American worker is more productive, more educated, more connected, and more economically precarious than at any point since the Great Depression.
The EPI’s analysis is direct: the income that should have gone to typical workers went to two places — very highly paid workers (primarily corporate executives and financial sector professionals) and capital owners (shareholders). This isn’t conjecture. It’s the math required to explain why GDP kept growing while median wages didn’t.
The CEO-to-worker pay ratio tells the story concisely. In 1965, the average CEO of a major U.S. company made roughly 20 times the wage of a typical worker. By 2022, that ratio had climbed above 300:1. CEO compensation grew roughly 1,200% between 1978 and 2022 — adjusted for inflation. Typical worker compensation grew about 15% in the same window.
This happened during the same period when shareholder primacy became the dominant corporate ideology — the idea, popularized by economist Milton Friedman and institutionalized in the 1980s and 1990s, that corporations exist to maximize returns to shareholders, and that everything else is secondary. Workers aren’t a constituency in that framework. They’re a cost to be optimized.
That philosophy built the wealth gap Millennials and Gen Z are now trying to climb over. It’s why Social Security is running toward insolvency — because the payroll tax base stagnated when wages did. It’s why Medicaid cuts hit hardest for working-age adults who work full-time and still can’t afford private coverage.

The standard conservative rebuttal to the productivity-pay gap is: wages look flat because you’re not counting benefits. Add in employer-provided health insurance, retirement contributions, and paid leave, and total compensation looks more like productivity growth.
The EPI addressed this directly, and the math is uncomfortable. Yes, benefits are a real part of compensation. But the largest “benefit” growth over the past 40 years has been in health insurance costs — costs that workers, not employers, bear in an increasing share. Employer health insurance contributions have grown — but so have premiums, deductibles, and out-of-pocket maximums. What looks like a “benefit gain” on the ledger is increasingly a cost shift back onto the worker.
The pension-to-401(k) shift is the same story. Employers replaced defined-benefit pensions — guaranteed income in retirement — with defined-contribution 401(k)s that transfer all investment risk to the worker and require the worker to fund them. The “retirement benefit” didn’t disappear from the spreadsheet. It just moved from employer obligation to worker responsibility.
When you strip out the accounting tricks and look at what workers actually take home, and what their effective purchasing power is relative to what they produce, the gap is real. It’s documented by the BLS, the EPI, the Federal Reserve, and the Hamilton Project. The argument that benefits close the gap doesn’t survive contact with the actual data.
According to the Economic Policy Institute’s January 2026 update, U.S. net productivity grew 90.2% between 1979 Q4 and 2025 Q3. Over the same period, hourly compensation for a typical worker grew just 33%. Between 1973 and 2013 alone, productivity rose 74% while typical worker pay rose only 9%.
Researchers point to a combination of policy shifts: the collapse of private-sector union membership, erosion of the real minimum wage through inflation, deregulation that reduced worker bargaining power, anti-trust retreat enabling corporate consolidation, and tax policy changes that made redirecting productivity gains to executives and shareholders far more financially attractive. This was not an accident of markets — it was the result of specific decisions made over several decades.
Private sector union membership for men fell from 34% in 1973 to under 8% by 2007, and has continued declining since. The steepest drop came in the early 1980s, when organized labor lost 2.7 million members between 1980 and 1984. Declining unionization accounts for an estimated 10–20% of wage inequality growth among men during that period.
No — the gap is most severe for low- and middle-wage workers. The bottom 90% of earners saw annual wages grow about 44% between 1979 and 2023 — roughly 0.6% per year. The top 1% saw far larger gains. Workers at the very top of the income distribution have seen wage growth that tracks closer to productivity growth, because much of the productivity surplus went to executive compensation and investment returns rather than to the broad labor force.
Productivity and compensation data from the Economic Policy Institute Productivity-Pay Gap tracker (updated January 16, 2026). Union membership statistics from Western and Rosenfeld (2011), American Sociological Review and Bureau of Labor Statistics Monthly Labor Review. CEO compensation data from EPI CEO pay analysis. Wage stagnation benchmarks cross-referenced with Pew Research Center and The Hamilton Project. All data inflation-adjusted using BLS CPI unless otherwise noted.