
US healthcare is so expensive because the system was built — by accident and by lobbying — to maximize revenue extraction at every layer: insurers, hospitals, drug companies, and administrators all take their cut before a single doctor touches a patient. The United States spent $5.3 trillion on healthcare in 2024 — $15,474 per person — more than double what peer nations spend per capita, while ranking dead last among 10 wealthy countries on health outcomes. The gap between what Americans pay and what they receive is not a bug. It is the feature.

Key Takeaways:
- The US spent $5.3 trillion on healthcare in 2024 — $15,474 per person, 17.2% of GDP.
- Peer nations average $7,860 per person — Americans pay nearly twice as much for worse outcomes.
- The CBO estimates $528 billion per year in pure administrative waste from the multi-payer private insurance system.
- Private insurers spend 16 cents of every premium dollar on overhead vs. 1.6 cents under a single-payer model.
- Hospital consolidation has driven private insurance rates to 224% of Medicare rates on average.
- 89% of physicians say prior authorization contributes to burnout; doctors spend ~16 hours/week on paperwork.
- The US ranks last among 10 wealthy nations on health outcomes and has the most preventable deaths per capita.
- Employer-based insurance was an accident of WWII wage controls — never designed as a healthcare system.
- UnitedHealth Group alone posted $400 billion in revenue and $14.4 billion in profit in 2024.
Why Is US Healthcare So Expensive? The Short Answer
Every other wealthy country on Earth has figured out how to insure most or all of its citizens for roughly $6,000–$8,000 per person per year. The United States spends $15,474. The difference — roughly $7,000–$9,000 per American, every year — doesn’t go to better doctors, better hospitals, or longer lives. It goes to insurance overhead, hospital markups, pharmaceutical patents, and an administrative apparatus so sprawling it employs more billing clerks than nurses.
There is no single villain. US healthcare costs are the product of a system assembled over 80 years through wartime accidents, deliberate corporate lobbying, and a political system structurally incapable of taking on the industries that profit most from the status quo. But the reasons are well-documented, the numbers are staggering, and the human cost is real: Americans pay the most and live the shortest lives of any peer nation.
Here is how it happened — and who’s getting rich while you go broke. (For a related look at the downstream cost crisis, see our coverage of the insulin price crisis, private equity hospital buyouts, and the long-term care insurance collapse.)

How Much Does the US Spend on Healthcare — and What Does That Buy?
The numbers are not in dispute. According to CMS National Health Expenditure data, US healthcare spending grew 7.2% in 2024 to $5.3 trillion — 18% of the entire US economy. That’s $15,474 for every man, woman, and child in the country, every year, regardless of whether they ever see a doctor.
Compare that to what peer countries spend, per the Peterson-KFF Health System Tracker using OECD data:
- United States: $14,775 per person (2024 consumption expenditure)
- Switzerland (next highest): ~$9,800 per person
- Germany: ~$8,000 per person
- France: ~$6,600 per person
- United Kingdom: ~$5,700 per person
- OECD high-income peer average: $7,860 per person
The US spends almost $5,000 more per person than Switzerland — and Switzerland is not exactly known for its budget healthcare. In 1970, the US spent 6% of GDP on health, similar to peers. By 2024, it was 17.2% vs. an 11.2% peer average. Something broke in the 1980s, and the gap has never closed.
What does this buy? Last place in health outcomes among 10 comparable wealthy nations, per the Commonwealth Fund’s Mirror Mirror 2024 report. More on that below.
“The U.S. ranks last on four of five health outcome measures. Life expectancy is more than four years below the 10-country average, and the U.S. has the most preventable deaths.” — Commonwealth Fund Mirror Mirror 2024
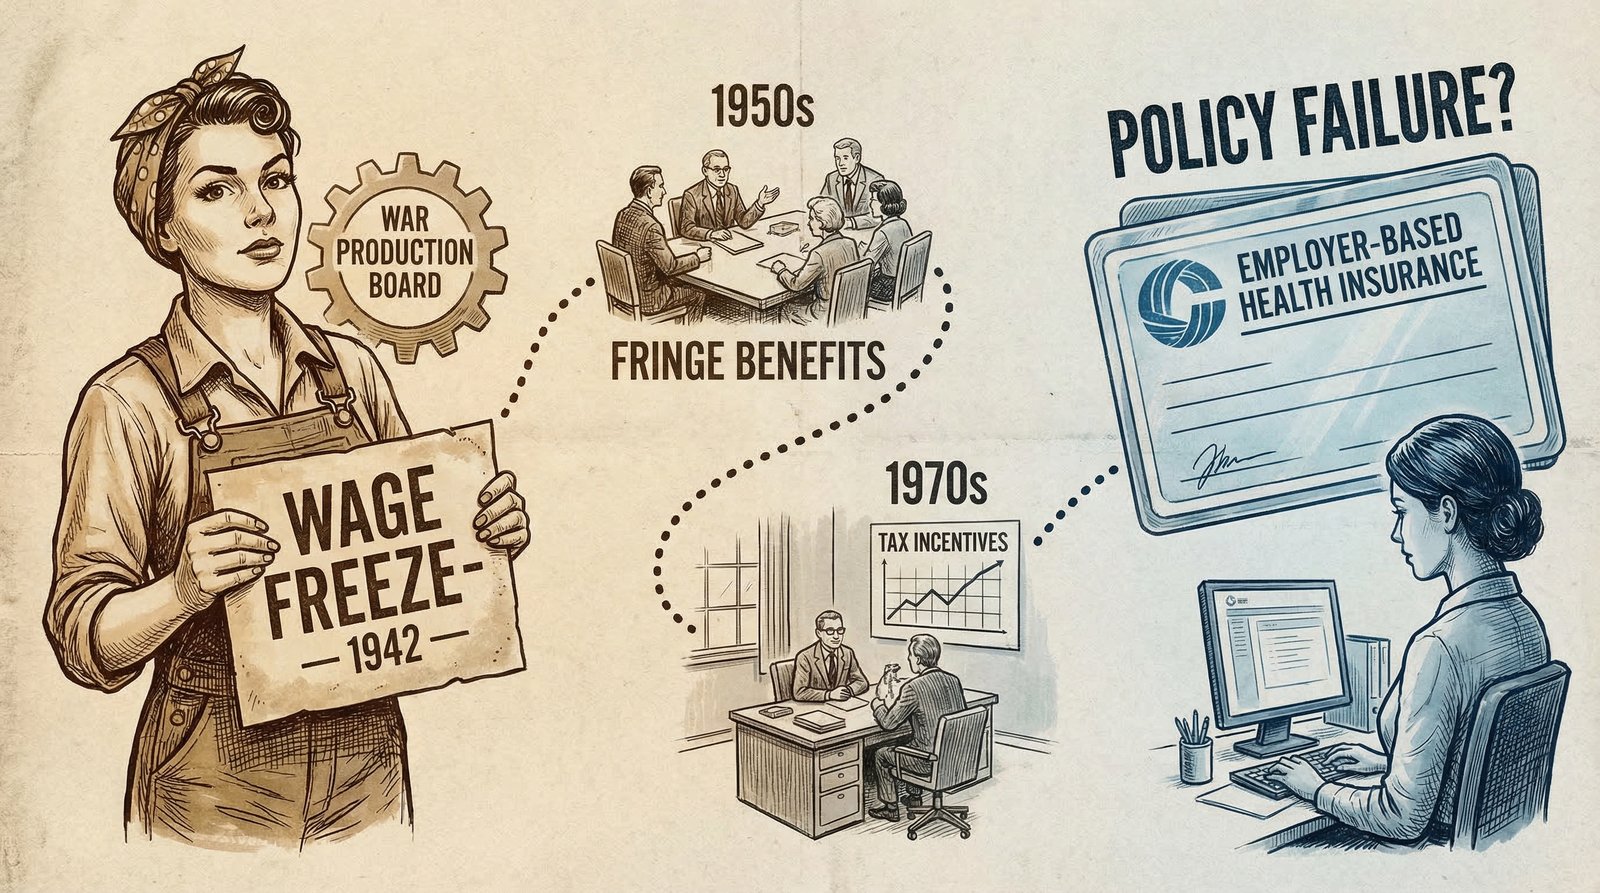
The Accident of History: How a 1942 Wage Freeze Trapped America in Employer Insurance
Every other wealthy country that built a national healthcare system did so intentionally — universal coverage through government negotiation, social insurance, or a national health service. The United States got its system through a wartime payroll accident and then spent the next 80 years optimizing that accident for the benefit of insurance companies and hospital corporations.
Here’s what happened. In 1942, with inflation surging and labor scarce, the Roosevelt administration froze wages under the Stabilization Act. Employers couldn’t offer higher salaries to attract workers — but the wage controls exempted fringe benefits like health insurance. So employers started offering health coverage as a competitive perk.
In 1943, the IRS formalized the tax exemption for employer-provided health benefits. In 1954, Congress made it permanent and expanded it. What had been a workaround for wage controls was now a structural feature of the American economy — and a $400 billion annual tax subsidy to employers to offer private insurance instead of the government building a universal system.
The consequences were profound:
- Coverage became tied to employment — lose your job, lose your insurance, during the exact moment you might need it most.
- Private insurers became the dominant intermediary — each setting its own rates, its own formularies, its own denial criteria, requiring every hospital and every doctor to staff entire departments just to manage billing.
- The US was the only wealthy country that went this route. Canada, Germany, Japan, and the UK all built universal systems by 1960. The US spent the following six decades in political gridlock, adding Medicare (1965) and Medicaid (1965) as patches, then the ACA (2010) as another patch — while the private insurance apparatus kept growing.
Nixon added another layer in 1973 with the HMO Act, which federally subsidized health maintenance organizations — a genuinely well-intentioned reform that inadvertently accelerated the corporatization of healthcare delivery that followed. McCarran-Ferguson (1945) had already exempted the insurance industry from federal antitrust law, handing state-level regulators the job of policing an industry that states consistently failed to keep in check.
The result: a system designed for wartime labor economics, bolted onto universal care ambitions it was never built to fulfill, entrenching a $400 billion annual tax subsidy that primarily benefits large employers and insurance companies.
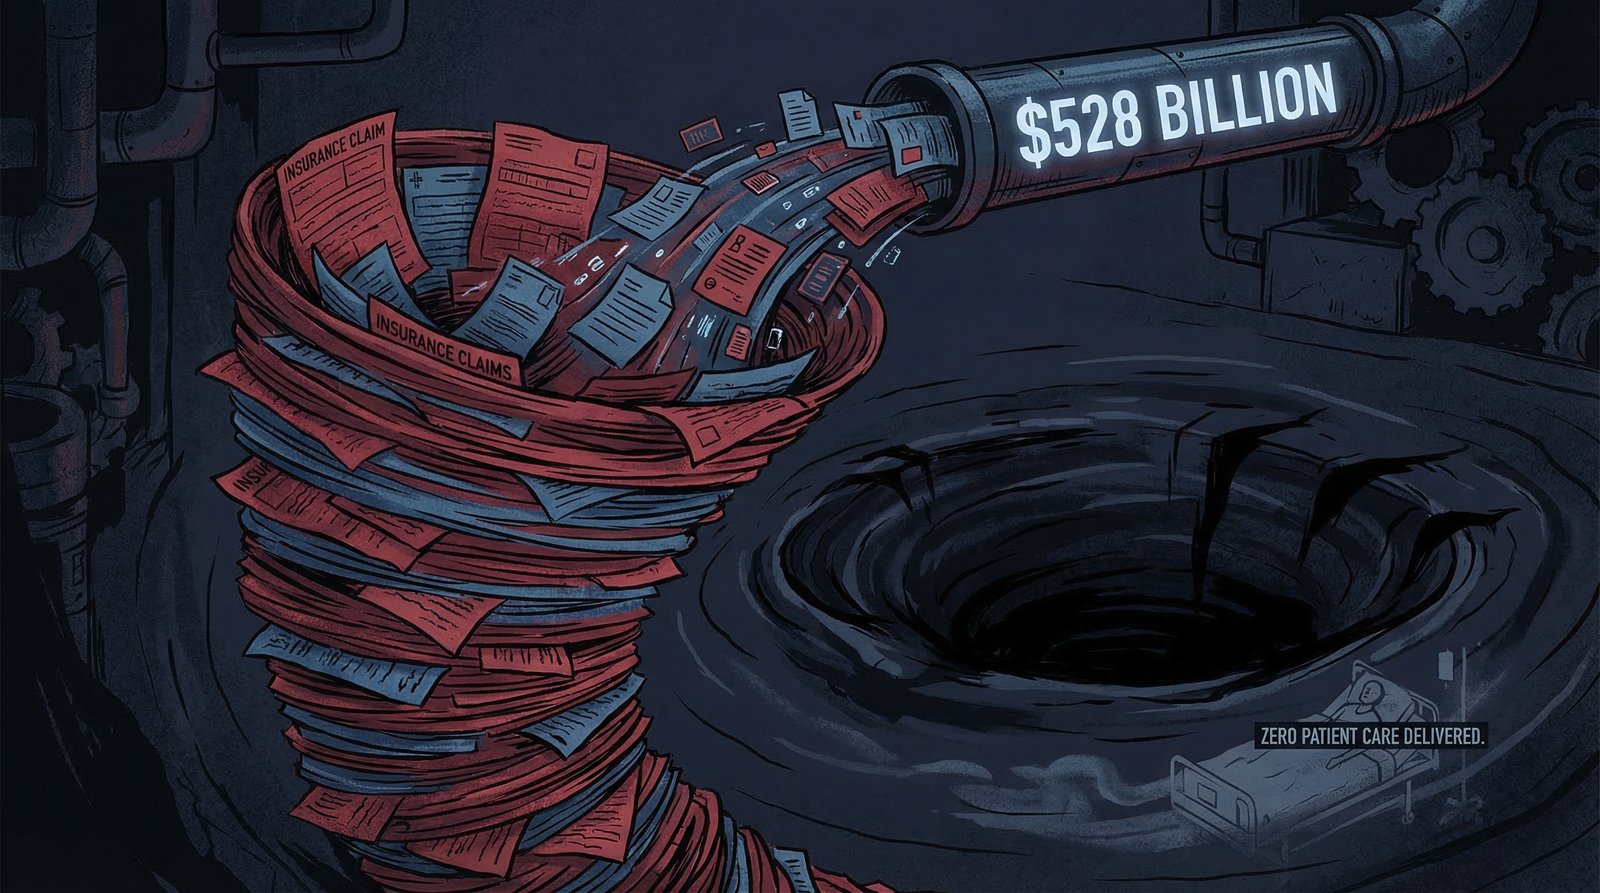
The $528 Billion Paperwork Tax: Administrative Waste Nobody Talks About
When healthcare policy debates happen, they focus on drug prices, hospital bills, and insurance premiums. What gets far less attention is the single largest structural driver of excess US healthcare spending: administrative overhead from running a multi-payer private insurance system.
According to the CBO’s single-payer analysis, excess administrative costs in the US healthcare system — the overhead that exists specifically because we run a fragmented private multi-payer system rather than a unified public payer — equal 1.8% of GDP, or approximately $528 billion per year.
That’s not total administrative costs. That’s the excess — what we pay above and beyond what the same system would cost under a unified payer. To put it in perspective: $528 billion is nearly twice what the entire federal civilian workforce costs, and larger than the entire US public college sector budget.
Where does the waste live?
- Private insurer overhead: For every $100 you pay in premiums, private insurers take $16 for administration, overhead, and profit — compared to $1.60 for a public single-payer insurer. Their administrative costs are 10 times higher.
- Hospital billing armies: Hospitals under the current system spend 19% of revenue on administration — vs. 12% under single-payer — because they must navigate hundreds of payers, each with different billing codes, denial criteria, authorization requirements, and appeal processes.
- Physician practice overhead: Primary care practices spend an estimated 14.5% of revenue on billing and insurance-related activities. Many small practices now spend more on billing staff than on clinical staff.
- Clearinghouses, coding firms, and denial management companies: An entire industry has emerged to manage the friction between providers and insurers — all of it pure overhead, all of it invisible to patients, all of it baked into what you pay.
This is not a marginal inefficiency. It is the biggest single correctable cost driver in American healthcare — and it barely comes up in policy debates because the industries that benefit from it spend hundreds of millions of dollars each year in lobbying to keep it invisible. (See our reporting on the revolving door and regulatory capture.)
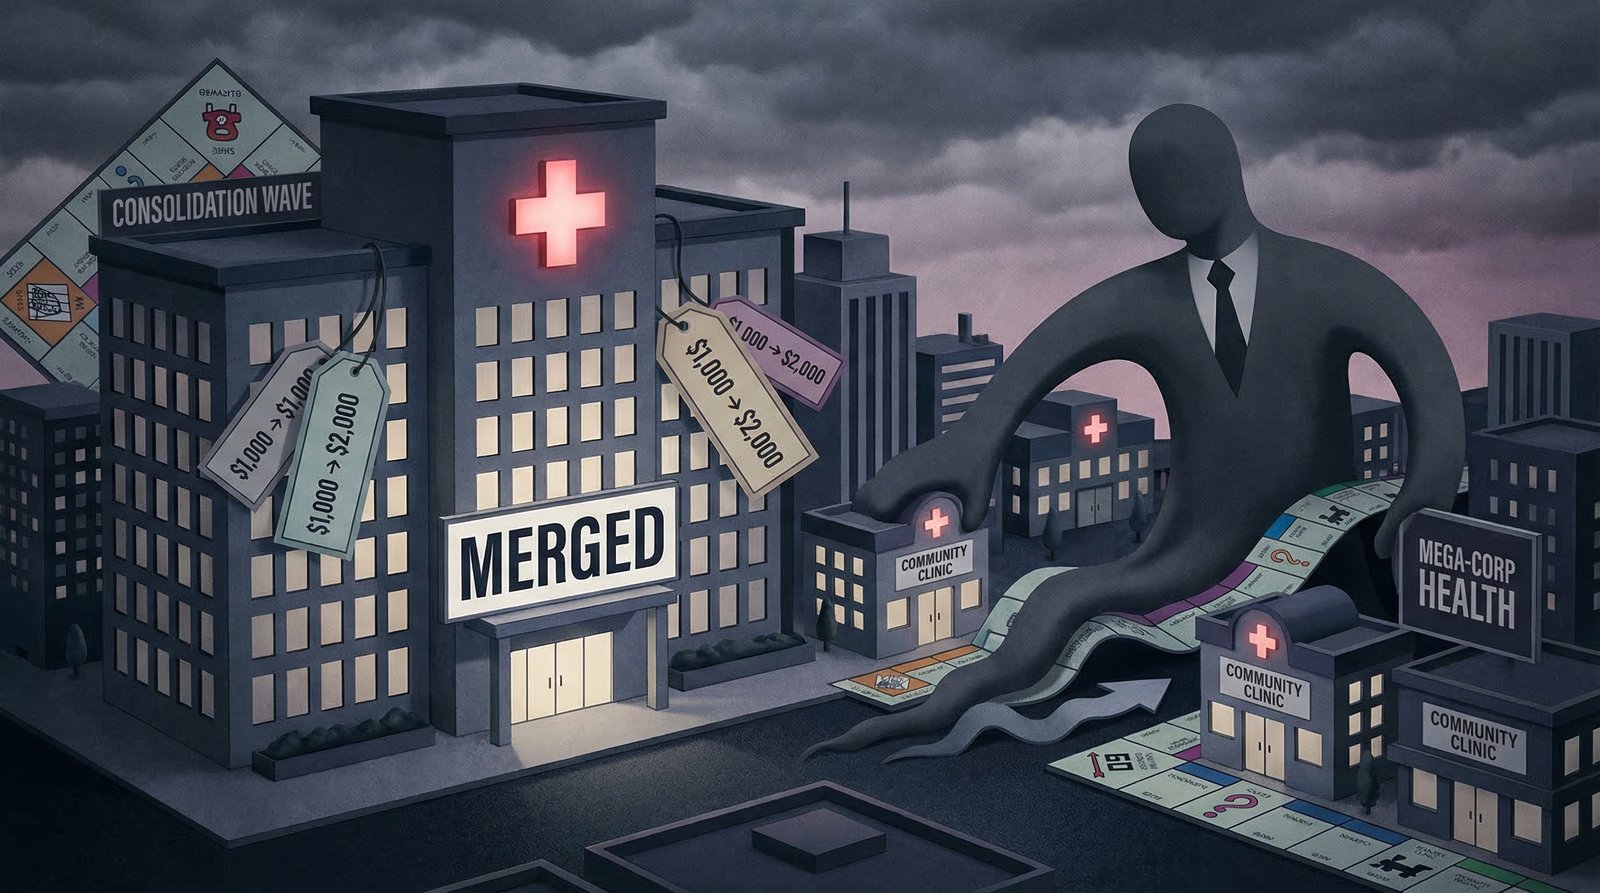
Hospital Consolidation: How Mergers Turned Your Local Hospital Into a Price-Gouging Machine
In a competitive market, prices fall as competitors fight for customers. In American healthcare, the opposite has happened: decades of hospital mergers have created regional monopolies that can charge whatever they want, and insurers — who profit from higher premiums anyway — lack the leverage or the will to push back.
The numbers are damning. A RAND Corporation study using 2020–2022 commercial claims data found that private employer-sponsored health plans pay hospitals an average of 224% of what Medicare pays for the same services. Some hospitals extract 300–400% of Medicare rates. After consolidation, prices at acquired hospitals rise by an average of 9–20% above already-inflated baselines.
The consolidation trend has accelerated dramatically. According to a 2025 GAO report, at least 47% of physicians were consolidated with hospital systems in 2024 — up from less than 30% in 2012. Each acquisition typically triggers price increases because hospitals can now bill facility fees for what were previously office visits, and because the consolidated system reduces the competitive pressure that kept rates in check.
The private equity angle makes this worse. As detailed in our investigation of private equity hospital buyouts, PE firms have systematically acquired community hospitals, cut clinical staff, maximized billing, and in several cases driven acquired hospitals into bankruptcy — leaving communities without healthcare and leaving taxpayers and Medicare to absorb the cost.
Private insurance pays hospitals an average of 224% of Medicare rates for the same services. In some markets, it’s 400%. The hospital doesn’t have to be better — it just has to be the only one left.
The consolidation dynamic also explains why drug prices are so high. Hospital systems acquire physician practices and then require those physicians to prescribe drugs purchased through hospital supply chains — which operate at hospital markup rates rather than retail or PBM-negotiated rates. A Yale study published in 2025 found that hospital acquisition of physician practices drives price increases of 9% on top of already-elevated post-consolidation baselines.
Prior Authorization Hell: The System That Denies Care to Protect Insurance Profits
Prior authorization is ostensibly a cost-control tool: before a doctor can prescribe a drug, order an imaging test, or refer a patient to a specialist, the insurance company reviews the request and decides whether it’s “medically necessary.” In practice, it is a delay-and-deny machine that burns physician time, delays patient care, and — under the medical loss ratio rules — actually benefits insurer profits.
The AMA’s 2024 physician survey findings are striking:
- 93% of physicians say prior authorization delays patient access to necessary care.
- 89% of physicians say prior authorization contributes to physician burnout.
- 88% report it leads to care abandonment — patients who give up when the fight gets too hard.
- The average physician handles nearly 40 prior authorization requests per week, consuming roughly 12–16 hours of physician and staff time.
- 33% of physicians report prior authorization has led to a serious adverse event for a patient — delayed surgery, worsened condition, hospitalization that could have been prevented.
In 2024, Medicare Advantage insurers processed 53 million prior authorization determinations, fully or partially denying 4.1 million (7.7%), according to KFF data. That denial rate understates the real impact: the majority of care delays happen before a formal denial, as physicians and patients simply abandon treatments that require weeks of back-and-forth paperwork.
The financial logic is perverse. Under the Affordable Care Act’s medical loss ratio rules, insurers must spend at least 80–85% of premiums on care. That means the more care costs, the more absolute profit insurers can book. Prior authorization doesn’t primarily save insurers money by denying claims — it primarily delays care long enough that patients give up, which reduces the denominator while keeping the premium base high. The insurer collects the premium whether or not the care is ever delivered.
CMS finalized a rule in 2024 requiring insurers to respond to urgent prior auth requests within 72 hours and routine requests within 7 days — a modest improvement from the weeks-long waits that had become standard. The rule applies only to Medicare Advantage and Medicaid managed care plans; commercial insurance remains largely ungoverned on authorization timelines.
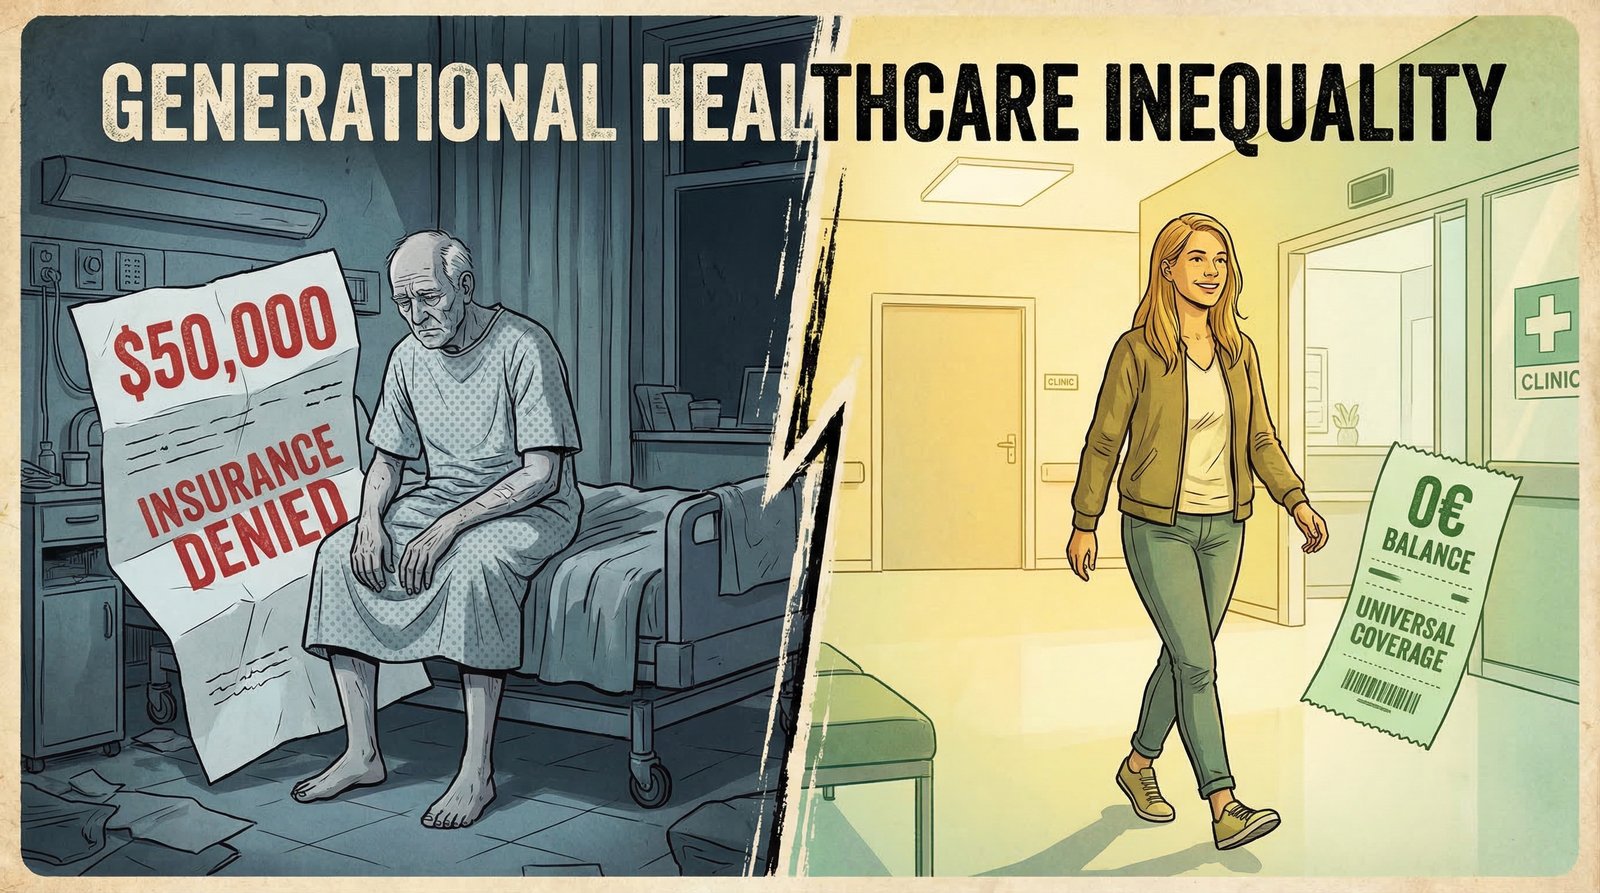
What Americans Get for $5.3 Trillion: Last Place in Outcomes Among Peer Nations
If the US healthcare system were merely expensive but effective, the numbers would still be alarming. The system is both expensive and failing. The Commonwealth Fund’s Mirror Mirror 2024 report — which compares the healthcare systems of 10 wealthy nations including Australia, Canada, France, Germany, the Netherlands, Norway, Sweden, Switzerland, the UK, and the US — ranks the United States:
- Last overall on health system performance.
- Last on health outcomes — including healthy life expectancy, disease burden, and avoidable mortality.
- Last on access to care — the highest rates of cost-related care avoidance and the highest rates of difficulty affording care.
- Last on equity — the largest income-based disparities in health access and outcomes of any peer nation.
- Life expectancy 4+ years below the 10-country average.
- Most preventable deaths per capita — Americans die preventably at higher rates than citizens of every comparable nation.
Life expectancy in the US is 77.5 years. Japan achieves 84+ years at roughly a quarter of US per-capita spending. Germany: 81 years at $8,000 per person. The UK: 81 years at $5,700 per person. The US is paying $15,474 to die 4 years sooner than average.
The uninsured and underinsured dimension compounds this. Despite the ACA, roughly 25–30 million Americans remain uninsured in 2024. Millions more are underinsured — they have coverage but deductibles and out-of-pocket maximums so high they effectively can’t afford to use it. The average family employer-sponsored health plan in 2024 now costs over $25,000 per year in combined employer and employee premiums, per KFF data, plus deductibles that can reach $3,000–$6,000 per person before coverage kicks in meaningfully.
Meanwhile, UnitedHealth Group — the largest health insurer in the country — posted $400.3 billion in revenue and $14.4 billion in net profit in 2024, per company filings. Cigna, CVS/Aetna, Humana, Elevance (Anthem), and Centene combined for hundreds of billions more. The insurance industry’s administrative apparatus isn’t failing. It’s working exactly as designed.
The Counter-Argument: America Has the Best Healthcare in the World (For Some People)
The standard defense of American healthcare goes: the US has the best medical technology, the most cutting-edge treatments, the fastest access to specialists, and the highest cancer survival rates in the world. If you have good insurance and a serious disease, there is nowhere better to be treated.
This is true, and it’s important. The US does lead in cancer care outcomes for insured patients, with 5-year cancer survival rates for many cancers among the highest in the world. The US produces more medical innovation, more FDA-approved drugs, and more breakthrough therapies than any other country. American medical research underpins healthcare globally.
The problem isn’t that the best American healthcare is bad. The problem is access to that healthcare is gatekept by cost, insurance status, geography, and administrative burden in a way that no peer nation tolerates. Germany and the Netherlands also have excellent cancer care — at half the cost and without the administrative nightmare. Japan has some of the best health outcomes in the world at roughly 25% of US per-capita spending.
The question isn’t whether the US has excellent healthcare for the wealthy and well-insured. It does. The question is whether a system that costs $5.3 trillion per year and leaves tens of millions uninsured or underinsured, ranks last in outcomes among peer nations, kills more Americans preventably than any comparable country, and forces physicians to spend 16 hours per week on paperwork — is worth defending as the only option.
The honest answer is that American healthcare is simultaneously the most expensive, the most innovative, and the most unequal healthcare system in the developed world. Those three facts coexist, and acknowledging all three is necessary to understand why fixing it is so politically difficult.
FAQ: Why Is US Healthcare So Expensive?
Why does the US spend so much more on healthcare than other countries?
The US runs a fragmented multi-payer private insurance system that generates $528 billion per year in excess administrative overhead alone. Add to that: hospital consolidation that has pushed private insurance rates to 224% of Medicare rates; pharmaceutical patent protections that result in US drug prices 2–10x higher than peer nations; employer-based insurance that creates coverage gaps tied to employment status; and a political system that has failed to apply the same negotiating leverage that every other wealthy country uses to control costs. Each driver is significant; combined, they produce a system that costs twice what peers pay for worse average outcomes.
What percentage of US healthcare spending is waste?
Estimates of healthcare waste vary by definition. The JAMA Network’s landmark 2019 study estimated total US healthcare waste — including administrative complexity, pricing failure, fraud, care delivery failures, overtreatment, and care coordination failure — at $760 billion to $935 billion per year. The CBO’s single-payer analysis attributes $528 billion specifically to administrative excess from the multi-payer private insurance model. Either way, a meaningful share of the $5.3 trillion spent annually on US healthcare generates zero health value.
Why is employer-based health insurance a problem?
Employer-based insurance ties coverage to employment, creating gaps every time Americans change jobs, get laid off, start businesses, or work part-time or gig economy jobs. It also leaves employers — not individuals, not the government — in charge of insurance decisions, creating a race to the bottom on coverage quality. And because employers receive a tax deduction for health benefits while the government doesn’t directly negotiate prices, there is no systemic cost-control mechanism. The $400 billion annual tax subsidy for employer-sponsored insurance primarily benefits large employers and their insurers, not workers.
Does the US have worse healthcare outcomes than other countries?
On population-level outcomes, yes — decisively. The Commonwealth Fund’s 2024 Mirror Mirror report ranks the US last among 10 wealthy nations on overall health system performance, including health outcomes, access, equity, and administrative efficiency. US life expectancy is 77.5 years — more than 4 years below the 10-country peer average. The US has the highest rate of preventable deaths per capita of any comparable nation. These outcomes exist alongside the US spending nearly double what peer countries spend per person.
Sources & Methodology
Data sources used in this article:
- CMS National Health Expenditure Fact Sheet 2024 — total US healthcare spending $5.3 trillion, $15,474 per capita, 18% of GDP
- Peterson-KFF Health System Tracker — US vs. peer country per-capita spending comparisons using OECD Health Statistics database (updated January 2026)
- OECD Health at a Glance 2025 — OECD average health spending per capita ~$6,000
- Commonwealth Fund Mirror Mirror 2024 — US health system rankings, life expectancy, preventable deaths, access and equity measures
- CBO Single-Payer Analysis 2022 — $528 billion excess administrative costs; insurer 16% vs. 1.6% overhead ratio; hospital 19% vs. 12% administrative share
- People’s Policy Project — “Health Care Administration Wastes Half a Trillion Dollars Every Year” (Dec 2024) — administrative waste analysis and comparison
- RAND Corporation — Prices Paid to Hospitals by Private Health Plans (2020–2022) — private insurance rates at 224% of Medicare average
- GAO — Health Care Consolidation Published Estimates 2025 — 47% of physicians consolidated with hospital systems in 2024
- AMA Prior Authorization Survey 2024 — 89% of physicians report burnout, 93% report care delays, 40 PA requests per week
- KFF — Medicare Advantage Prior Authorization 2024 — 53 million PA determinations, 4.1 million denials (7.7%)
- Reuters — US healthcare spending $5.3 trillion 2024 (January 2026)
- Healthcare Dive — UnitedHealth Group 2024 Results — $400.3 billion revenue, $14.4 billion net profit
Methodology: All spending figures are in nominal US dollars unless otherwise specified. OECD peer country comparisons use health consumption expenditure (excluding capital investment), adjusted for purchasing power parity where noted in source data. The $528 billion administrative waste estimate derives from the CBO’s 2022 single-payer analysis, which defines excess administrative costs as the difference between current system administrative expenditure and projected administrative expenditure under a unified single-payer model. This represents a conservative estimate; other analyses produce higher figures. Hospital price data from RAND uses 2020–2022 commercial claims; Medicare comparison uses same-period Medicare fee schedules.